Visualization Applications
Requesting New Applications: DesignSafe regularly adds new software applications in support of natural hazards engineering research. You may contact DesignSafe by submitting a help ticket if you would like to request the addition of a software application to the Workspace.
Getting Your Own HPC Application: For those researchers with larger computational needs on the order of tens of thousands, or even millions of core-hours, or if you have a software application that we don't support in the web portal, you may request your own allocation of computing time on TACC's HPC systems. Your files can still be stored in the Data Depot, allowing you to share your research results with your team members, as well as curate and publish your findings.
Commercial/Licensed Applications: The DesignSafe infrastructure includes support for commercial/licensed software. Wile in some cases licenses can be provided by the DesignSafe project itself, not all vendors will make licenses available for larger open communities at reasonable cost. You may contact DesignSafe by submitting a help ticket if you have questions regarding a commercial software application.
FigureGen User Guide
FigureGen is a Fortran program that creates images for ADCIRC files. It reads mesh files (fort.14, etc.), nodal attributes files (fort.13, etc.) and output files (fort.63, fort.64, maxele.63, etc.). It plots contours, contour lines, and vectors. Using FigureGen, you can go directly from the ADCIRC input and output files to a presentation-quality figure, for one or multiple time snaps. In contrast to the other Visualization Applications in the Workspace, FigureGen is not an interactive but rather it submits a batch job and output files are returned to the user.
More detailed information and FigureGen user documentation can be found on the FigureGen website.
How to Submit a FigureGen Job in the Workspace
- Select the FigureGen application from the Visualization tab in the Workspace.
- Locate your Input Directory (Folder) with your input files that are in the Data Depot and follow the onscreen directions to enter this directory in the form.
- Enter the FigureGen input file (.inp) into the form.
- Enter a maximum job runtime in the form. See guidance on form for selecting a runtime.
- Enter a job name.
- Enter an output archive location or use the default provided.
- Click Run to submit your job.
- Check the job status by clicking on the arrow in the upper right of the job submission form.
Hazmapper User Guide
Version 2.8
DesignSafe HazMapper is a rich web-based application for visualizing and analyzing geospatial data (assets).
NOTE: At this time, DO NOT include ".hazmapper" extension files in the list of pieces of a project to curate and publish with any project that needs to acquire a DOI. The curated map will not be public for viewing with the DOI. Instead, make a public version of the map, and include the URL of the public map in the project description.
Accessing Hazmapper
To access Hazmapper from Designsafe, the user can first navigate to the top menu bar and find Workspace (Fig 1.1).

Fig 1.1
From there, the user can hover on the Workspace section and select Tools & Application (Fig 1.2).
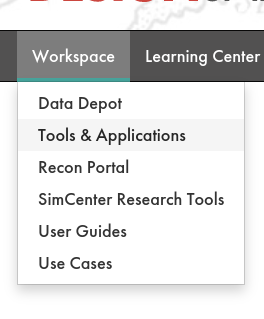
Fig 1.2
From the Tools & Applications page, the user can navigate to Hazmapper (2.0) (Fig 1.3) and then Launch Hazmapper (Fig 1.4).
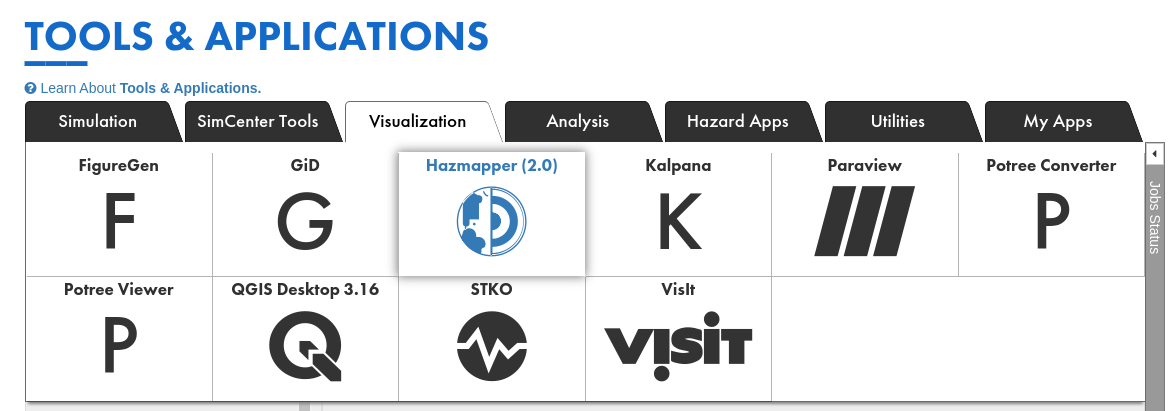
Fig 1.3
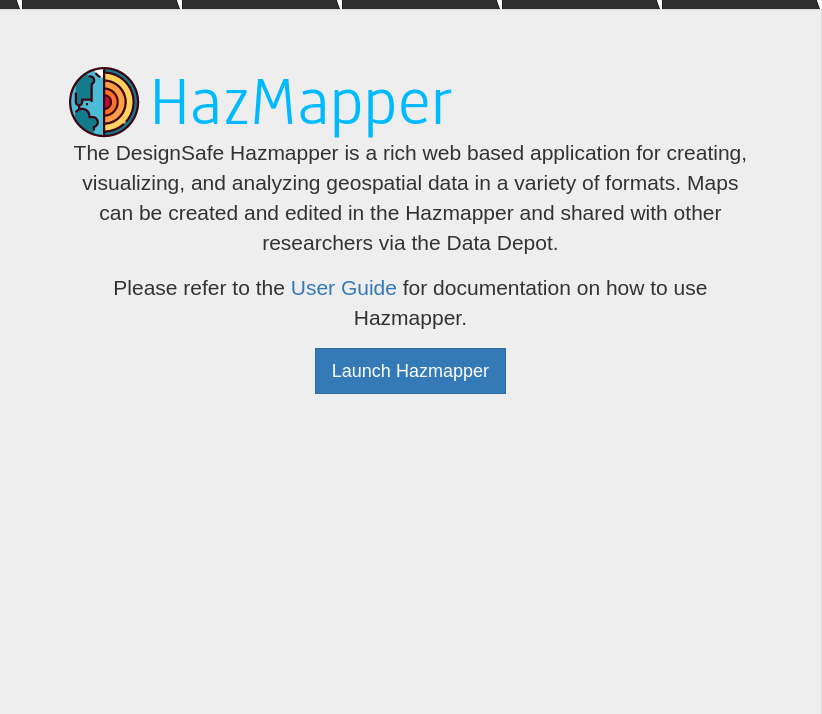
Fig 1.4
Interface Overview
Welcome Menu
The welcome menu is the first interface that the user will see. This menu lists all of the maps that are tied to the user either from creating the map or from a shared map (Fig 2.1).
The header of the menu displays the name of the map and the DesignSafe project that it is saved in. If it is saved to the Data Depot, it will show a ----------.
On the rightmost side of the header is the ![]() Create a New Map button, which opens the map creation prompt.
Create a New Map button, which opens the map creation prompt.
The icons on the right side of each map item are edit ![]() and delete
and delete ![]() .
.
To access a map, the user can either click on a map item or click on the edit ![]() button. To delete a map, the user can click on the delete
button. To delete a map, the user can click on the delete ![]() button of a map.
button of a map.
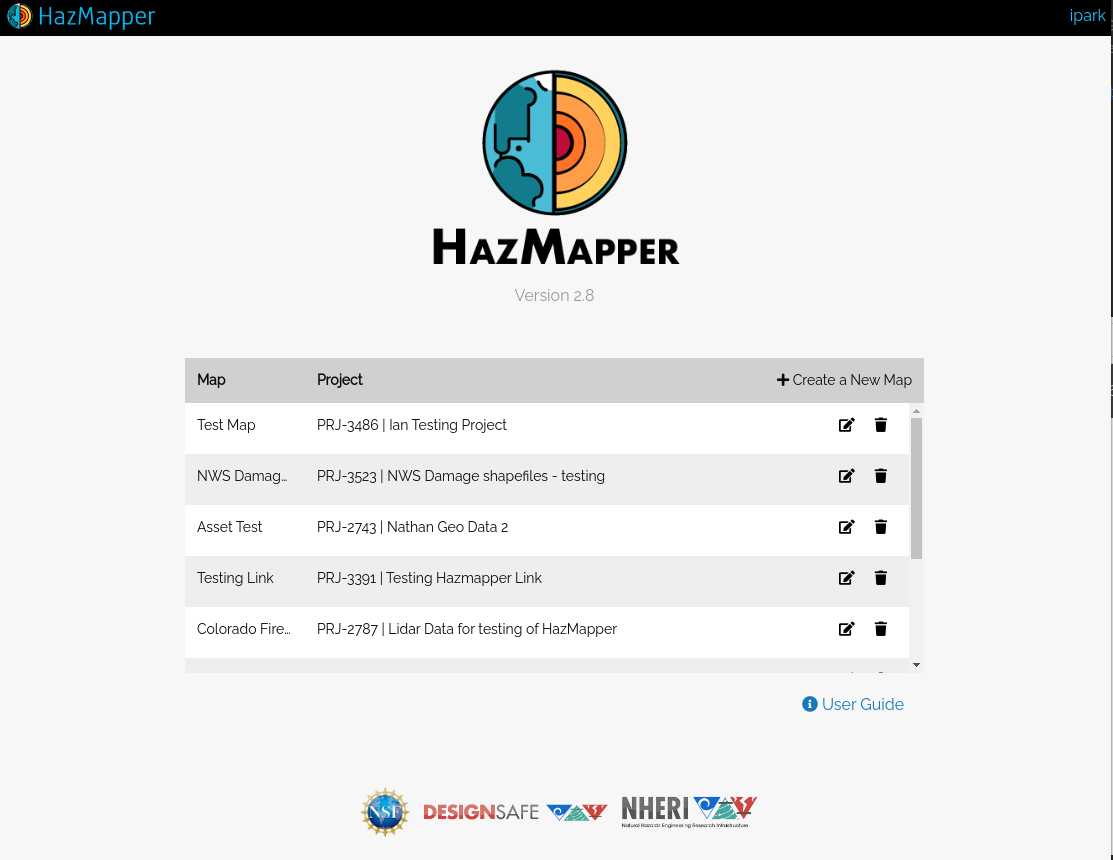
Fig 2.1
Map Creation Prompt
Clicking on the ![]() Create a New Map button from the welcome menu (Fig 2.2) will open the project creation prompt. This prompt will guide the user through options needed to create a map.
Create a New Map button from the welcome menu (Fig 2.2) will open the project creation prompt. This prompt will guide the user through options needed to create a map.
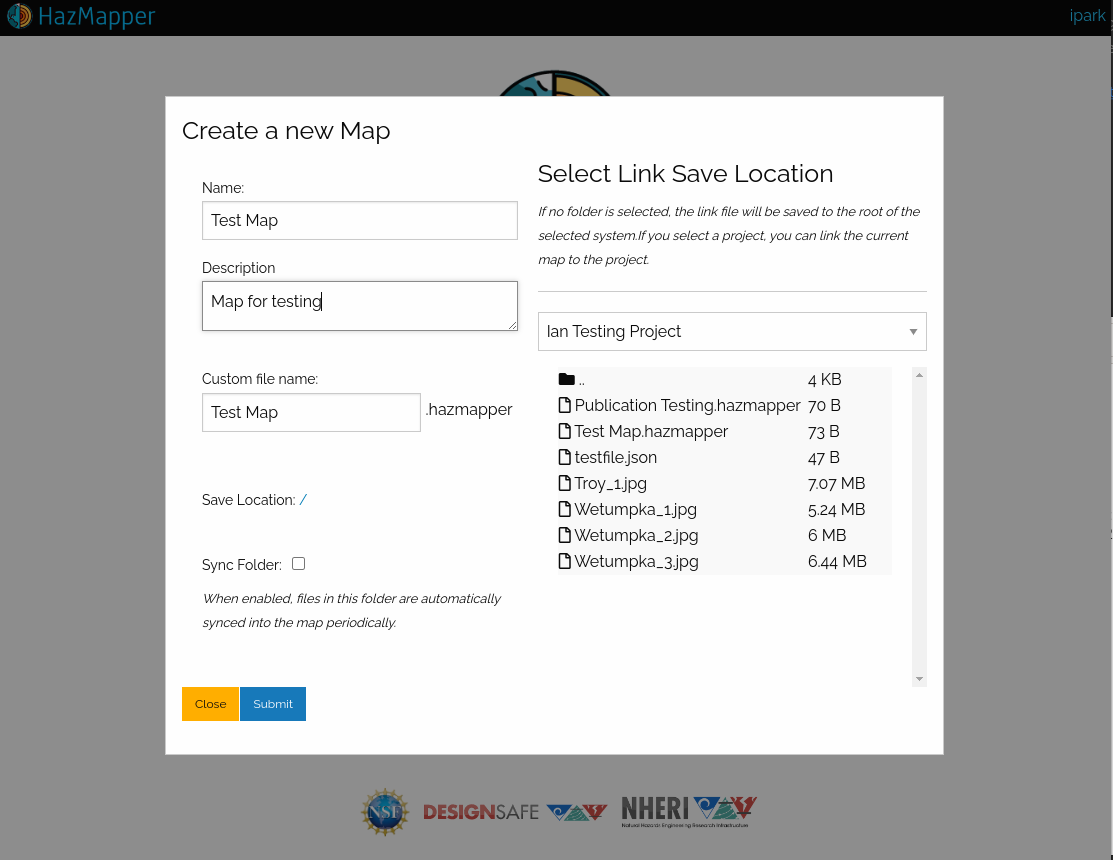
Fig 2.2
First, the user is required to give the map a name and a description.
Once the user selects the name and description, unless manually specified, the map will be saved to a file with the same name as the map name with a .hazmapper extension.
Next, by browsing through the file browser, the user can select a location in the DesignSafe Data Depot the map will be saved to.
For clarity, the selected location will be displayed in the Save Location section.
Finally, the user is given the option to sync the folder through the Sync Folder checkbox.
This will make the created map a syncing map.
Once you create a map or select a map from the welcome menu, you will see the following interface.

Fig 2.3
Title bar
We will start the overview of the map interface by first looking at the title bar section of the interface.
Starting from the left to right, we can see a left arrow button ![]() . Clicking on this button will bring the user back to the welcome menu we looked into in the previous section.
. Clicking on this button will bring the user back to the welcome menu we looked into in the previous section.
The next part of the title bar is the name of the map with the associated DesignSafe Project if it exists.
The last part of the title bar is the latitude and longitude coordinates indicating the location of the mouse cursor when hovering on the map.
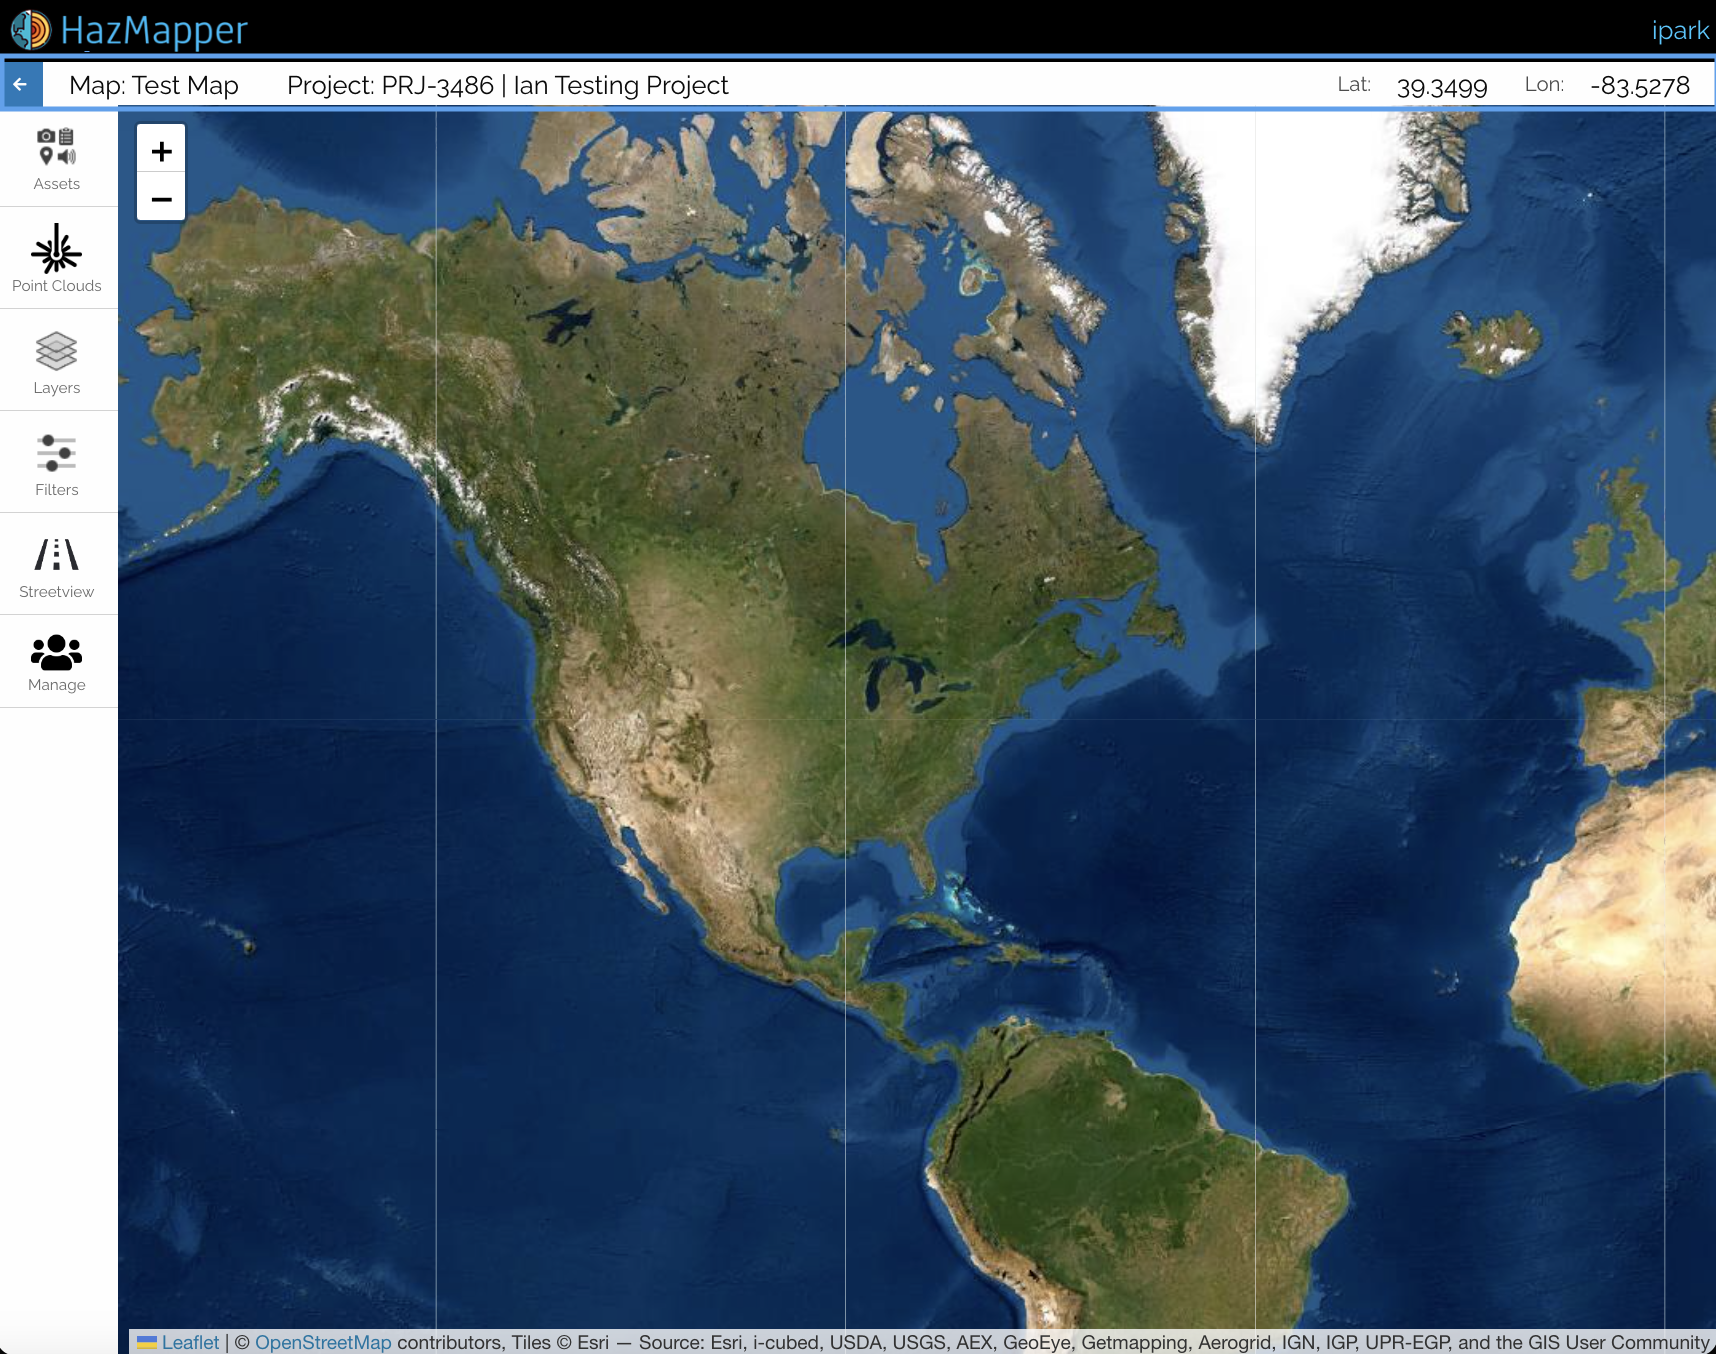
Fig 2.4
Panels
Next, we will take a look at the panel interface of Hazmapper.
Panels are the primary interface a user can interact with the map and handle assets on the map.
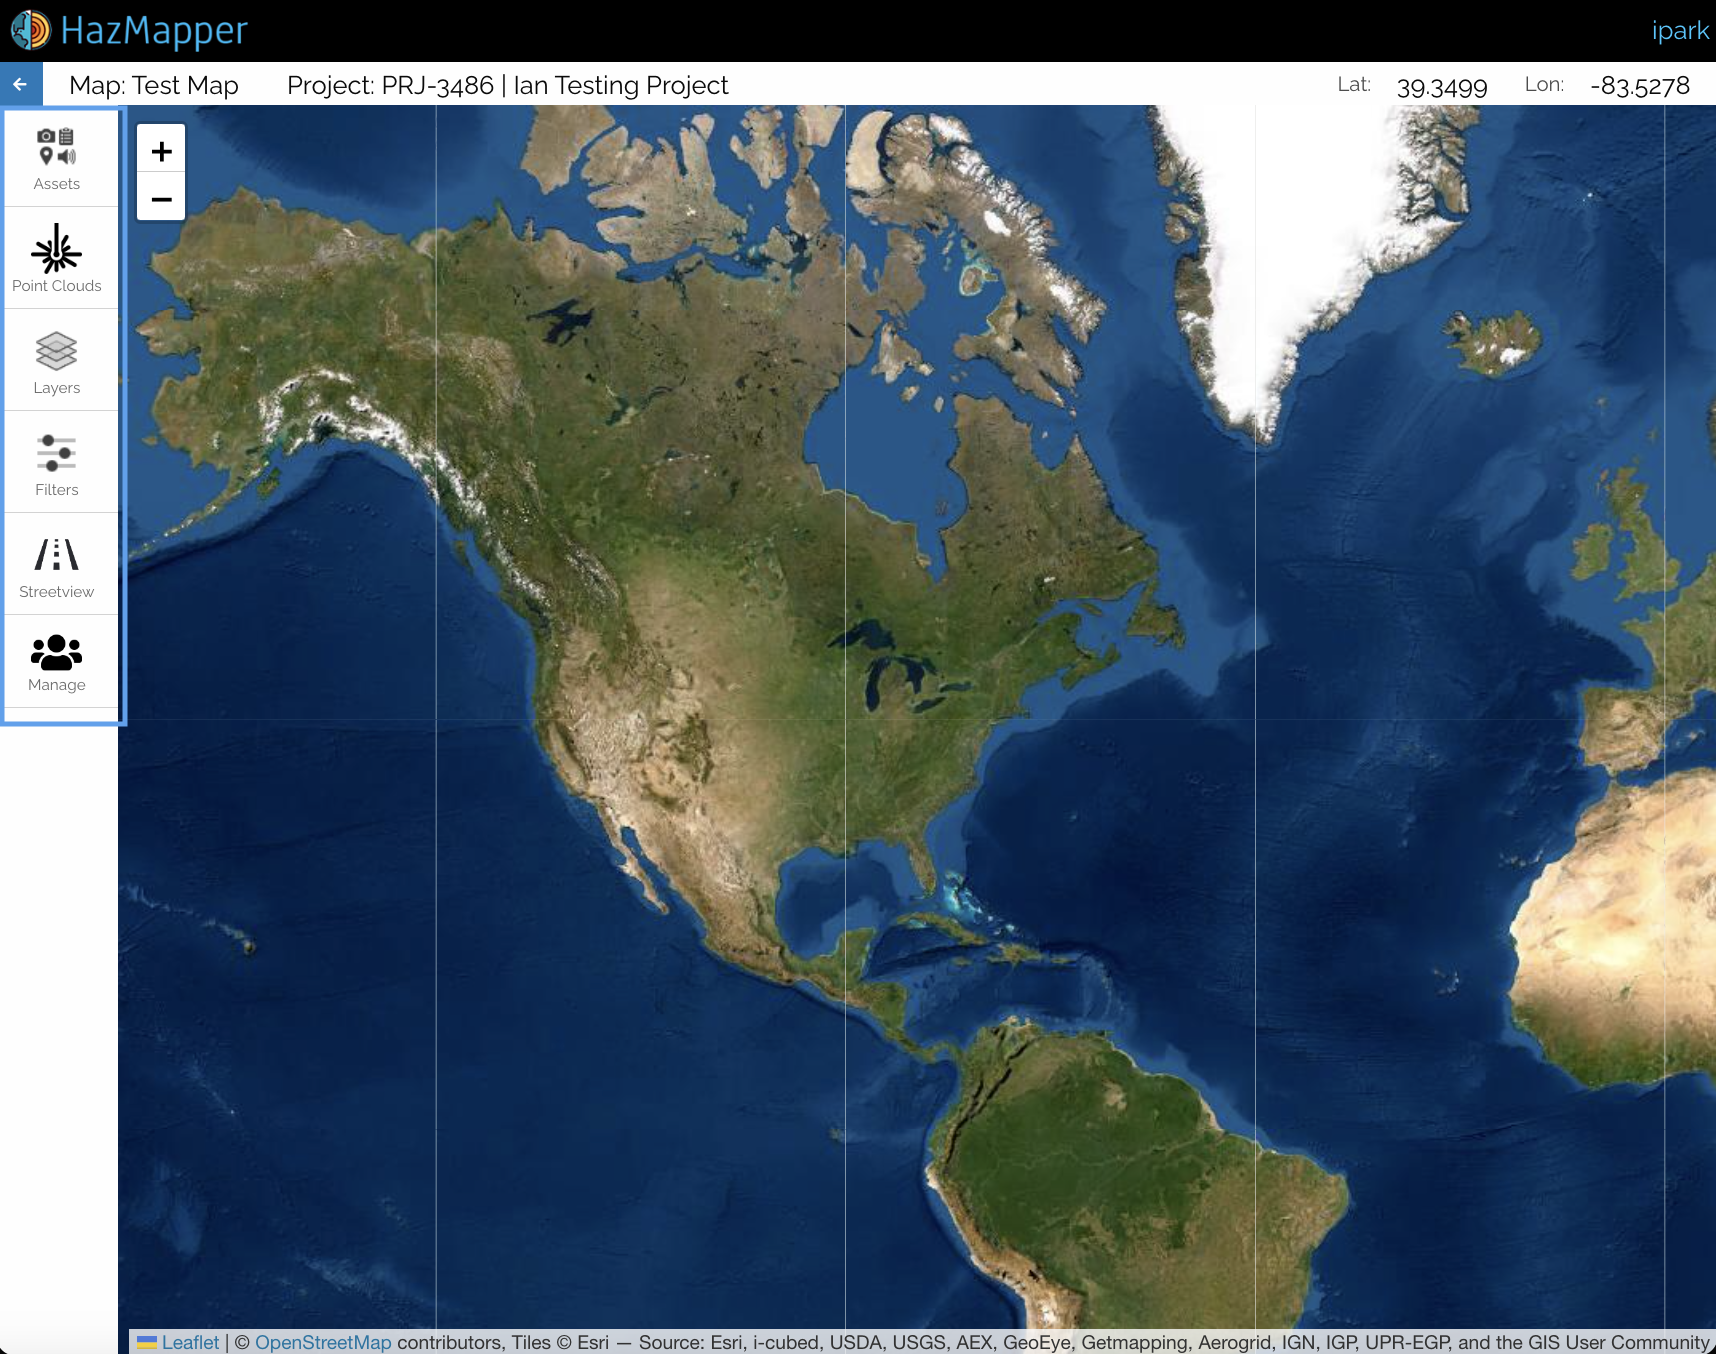
Fig 2.5
Assets Panel
The assets panel is the hub of all of the map-associated feature assets. Here users can add, view, and delete each asset.
By clicking on Import from DesignSafe, users can open the import prompt (Fig 2.6) and add appropriate files from DesignSafe Data Depot (My Data, Projects, Community Data, Published Data).
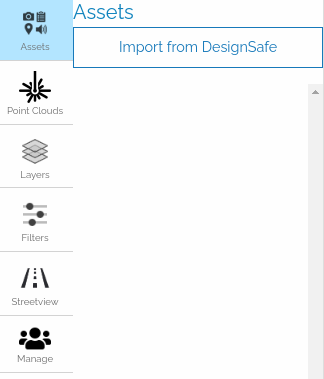
Fig 2.6
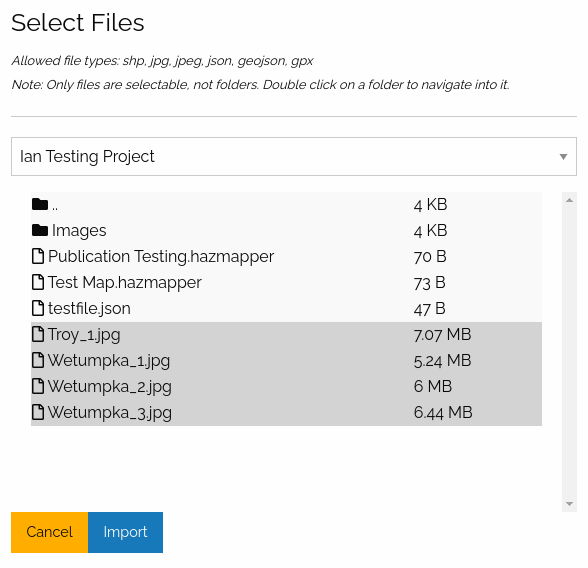
Fig 2.7
NOTE: The file browser works like the file browsers on our computers. Shift-Click allows the user to select multiple items. And Control-Click (only on Windows) allows the user to select multiple assets without losing the previous selection.
Once imported, the selected assets will be listed inside the panel. A user can click on each asset to jump to the asset location on the map or to get the metadata associated with the asset.
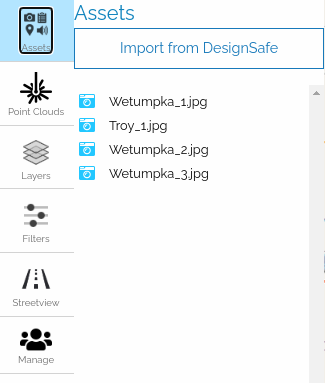
Fig 2.8
NOTE: Unless imported from the top-level (i.e. in the root of the folder), image, video, streetview assets will show up in the folders they are located in. On the other hand, point-cloud assets will always display at the root of the asset tree.
Point Clouds Panel
This panel allows users to create point cloud objects that associate point clouds assets (las or laz).
Note: Once the assets are attached they will show up in the Assets Panel.
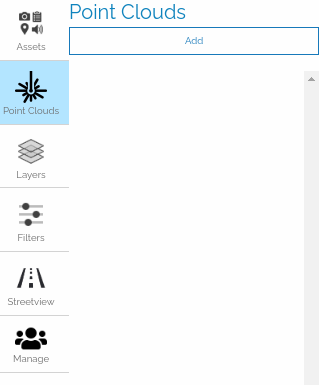
Fig 2.9
The user can open the point cloud creation prompt by clicking on the Add button.
In the point cloud creation prompt, the user is required to create a Description for the point cloud object (This will be the name displayed in the assets panel as well). After that, by clicking on the Submit button, the user can create a point cloud object.
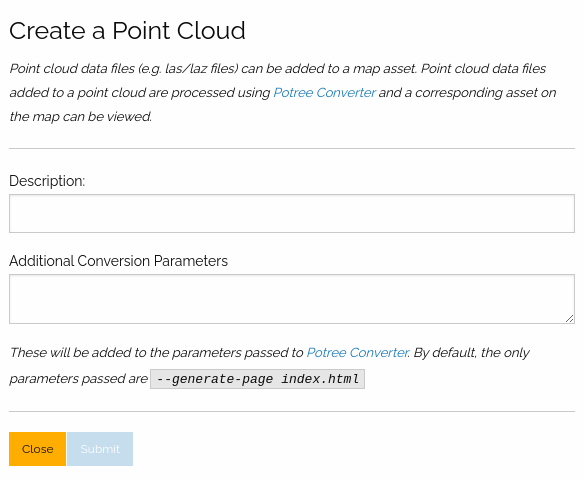
Fig 2.10
Once created, the point cloud object with be shown in the panel.
Now, the user can add a point cloud asset (las or laz), delete ![]() the point cloud object, or view
the point cloud object, or view ![]() the object information.
the object information.
To add a point cloud asset to the point cloud object, the user must click on the Add las/laz button.
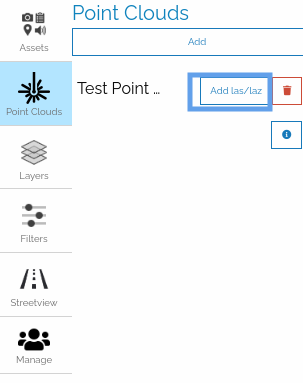
Fig 2.11
This will open a file browser, similar to the one used to import assets in the assets panel.
From the file browser, the user must select either a las or laz file and click Import.
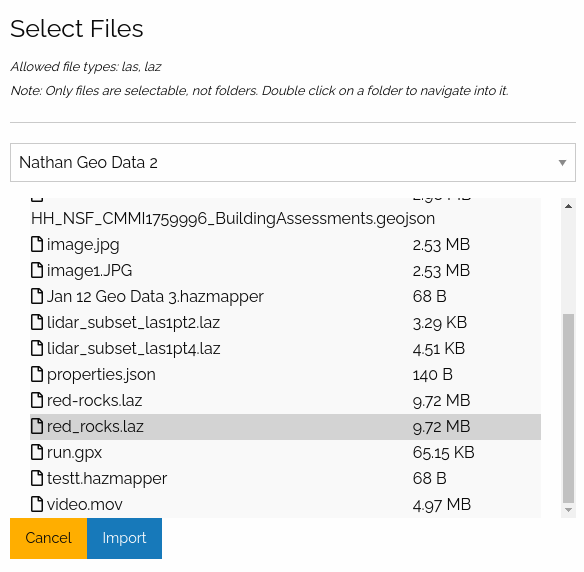
Fig 2.12
The import process will take a while depending on the size of the point cloud file. However, once imported, the asset should show up on the Assets panel and the map (as a bounding box covering the extent of the point cloud).
If the user clicks on the View button on the information box, the Potree Viewer will open.
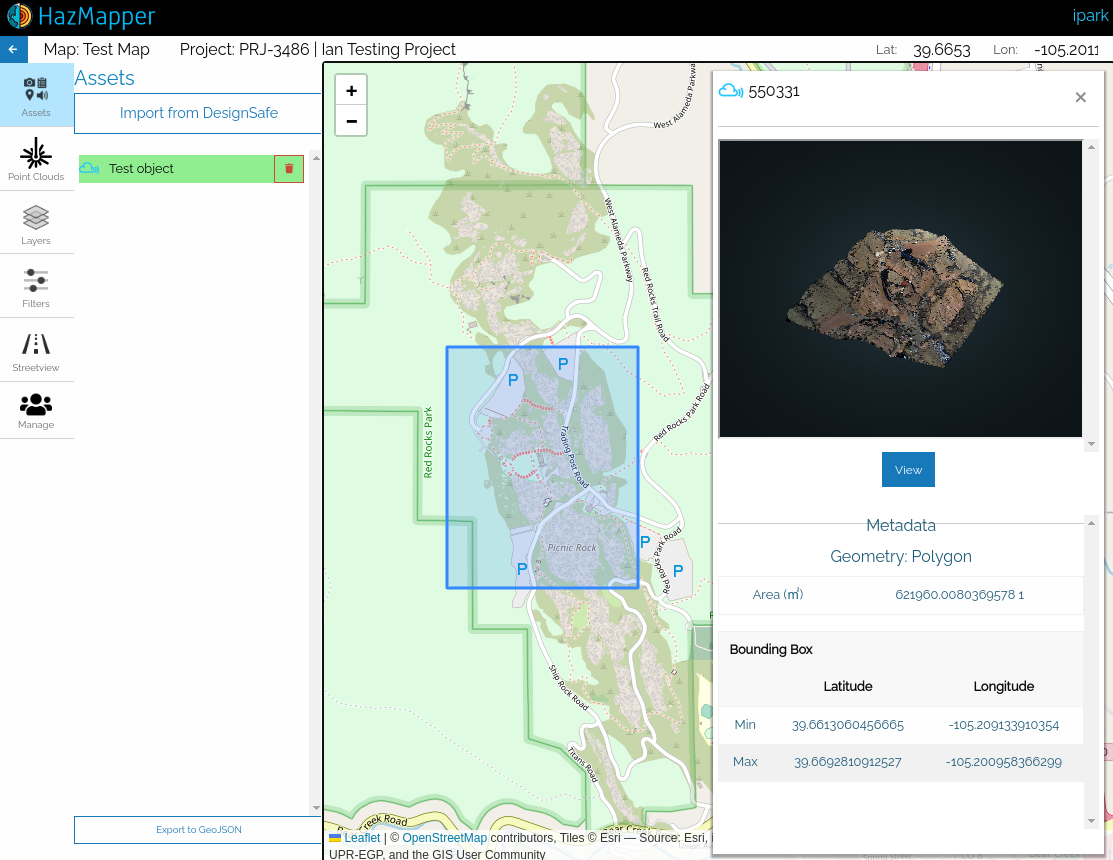
Fig 2.13
The Potree Viewer can be used for further analysis of the point cloud.
The URL to the Potree Viewer created for the asset will be permanent as long as the asset exists. Furthermore, this can be shared with other researchers.
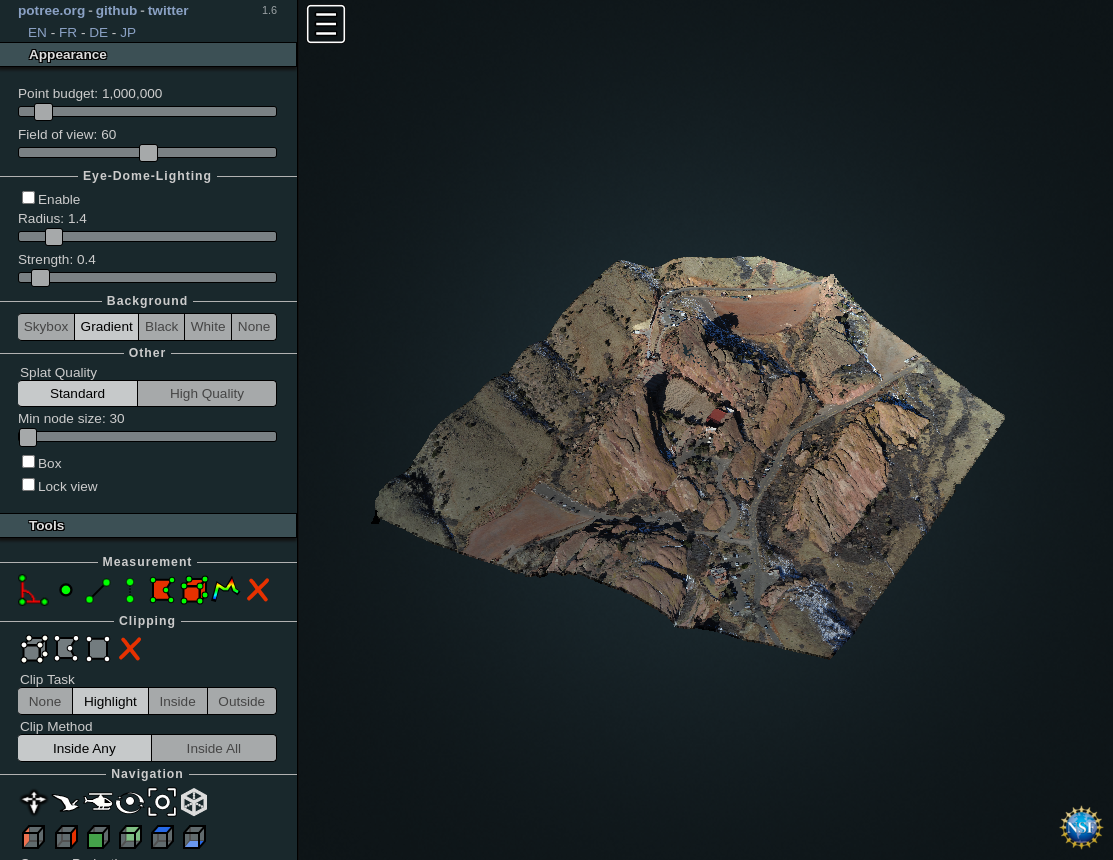
Fig 2.14
Layers Panel
Using this panel users can select, create, edit, or delete tile layers. By default, the user will see the Satellite and Roads basemap layers.
Additionally, users can create an overlay image for the map. This means, given a jpg image with their geospatial coordinates, users can select the bounding coordinates and place the raster data on the map.
By default, the Roads and Satellite base layers will be added and enabled.
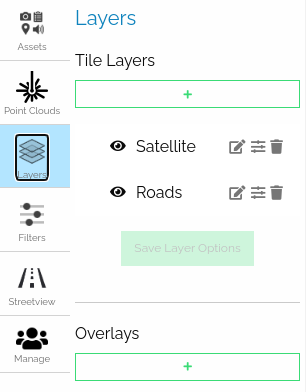
Fig 2.15
To add more layers, the user must click on the ![]() button directly under Tile Layers.
button directly under Tile Layers.
This will open the tile layer creation prompt.
The default layers (Roads, Satellites) can be added directly in the case that the user deletes the default layers.
Otherwise, the user can choose among the supported tile layer formats as the Import Method.
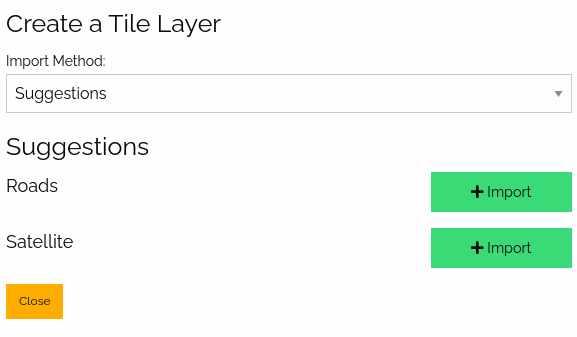
Fig 2.16
The Manual import method will have additional prompts that each tile layer type method requires.
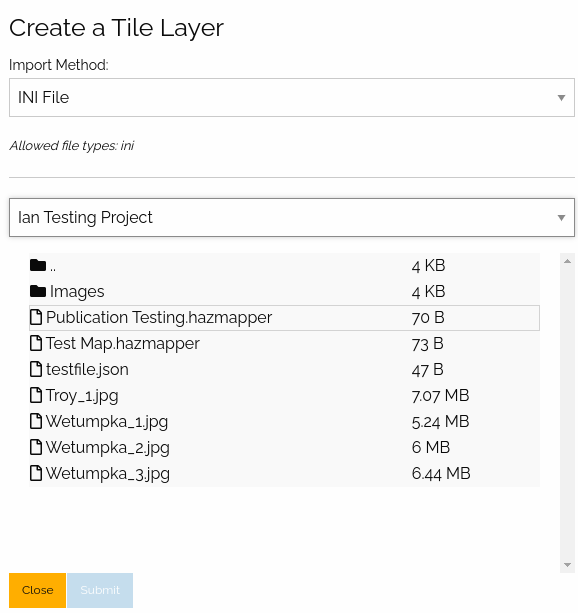
Fig 2.17
The INI file import method will show a file browser similar to the one used to import assets.
Here the user must select a .ini file containing the required tile layer data.
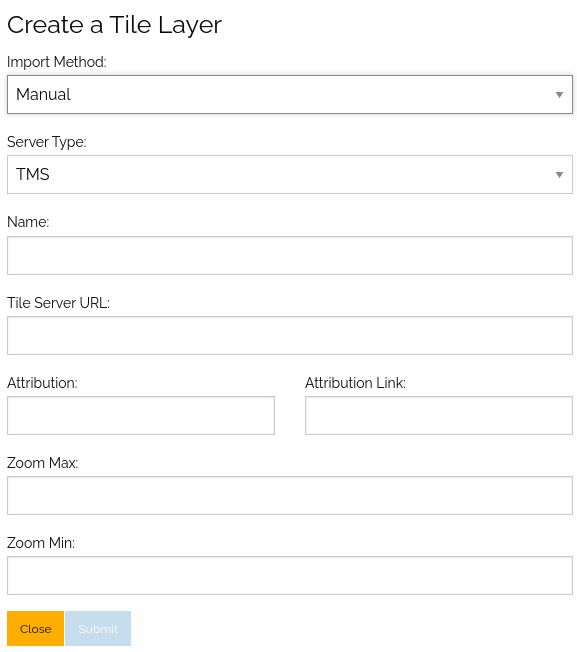
Fig 2.18
The QMS Search import method utilizes Quick Map Services to search for various tile layers and add them to the map.
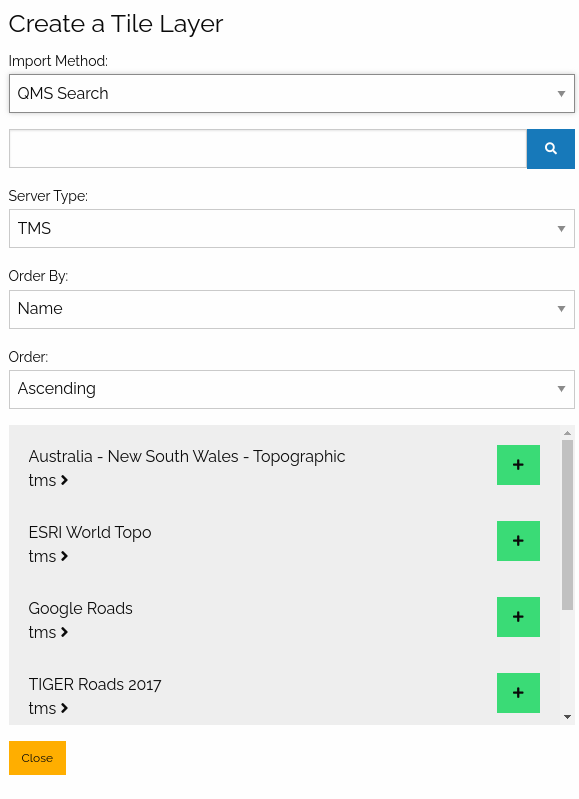
Fig 2.19
Once the user creates the tile layer, it will show up on the layers panel.
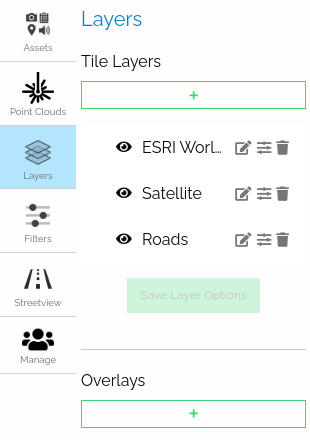
Fig 2.20
Each tile layer has controls to rename, toggle visibility, change the opacity, and delete.
If the user desires to preserve the changed options for collaborators or those with access to the public version of the map, the user must click on the Save Layer Options button.
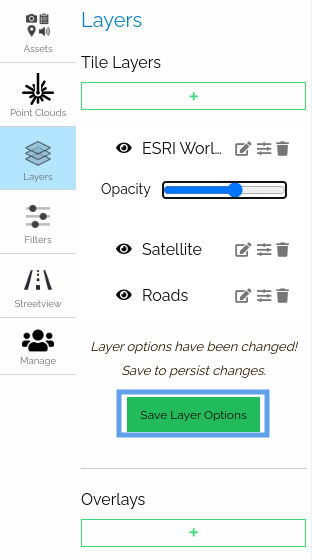
Fig 2.21
Filters Panel
Displayed assets can be filtered based on type (Images, Videos, Point Clouds, Converted Streetview, Non-asset Features) under this panel.
NOTE: Currently the date range filter is a placeholder that will be implemented in the future.
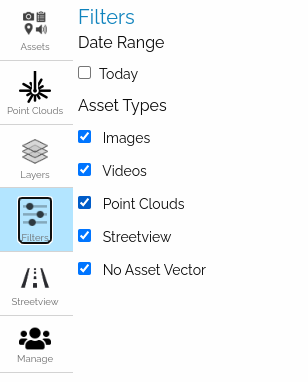
Fig 2.22
Streetview Panel
The streetview panel provides streetview functionality through an external service called Mapillary.
Because we rely on this external service, much of the functionality is catered to how the service works. Furthermore, there is some jargon accompanied by the functionality.
Mapillary Overview
Mapillary is a service that allows its users to import streetview imagery to view through their app. They also expose a tile-based API that allows other apps to integrate with their services.
Mapillary Terminology
- Organization: (mapillary documentation) This is somewhat like a shared account in Mapillary that can be accessed by multiple individual users to collaborate. Any user with access to an organization can upload streetview assets through it. We have a constraint in our upload workflow to enforce users to upload to a target organization and not their accounts. Thus, users can only work with assets through organizations and not from their personal Mapillary account.
- Sequence: (mapillary documentation) This is a unit of a collection of streetview images that Mapillary uses to organize their assets with a max size of 500 images. During upload, if the selected folder is more than 500 images, Mapillary will split the assets being uploaded into multiple sequences. Thus, a folder can be linked with multiple sequences.
- Processing: (mapillary documentation) This is a step in the upload process that takes place on the Mapillary side. Once all the data is transferred, Mapillary processes the images so that faces and car plates are blurred for privacy concerns. Thus, it will take some time after all the transferring (depending on how many images are uploaded at the same time).
[Logging in to Mapillary
To start using streetview assets with Mapillary, the user must log in to Mapillary.
NOTE: If a user is not registered to log in, one can create an account at the site before proceeding.
From the Streetview panel, the user can access the Login to Mapillary button.
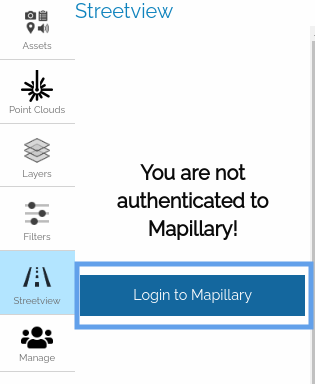
Fig 2.23
This will redirect the user to an external login page.
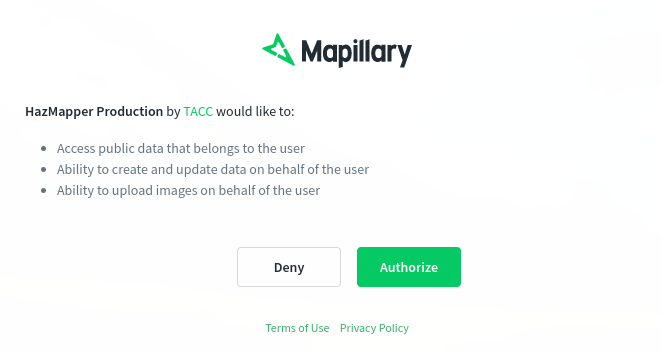
Fig 2.24
Once authorized from the external site, the user must provide Hazmapper a Mapillary username and at least one organization key of an organization.
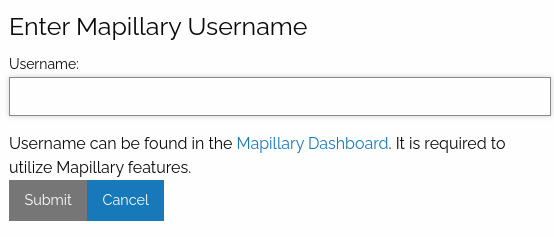
Fig 2.25
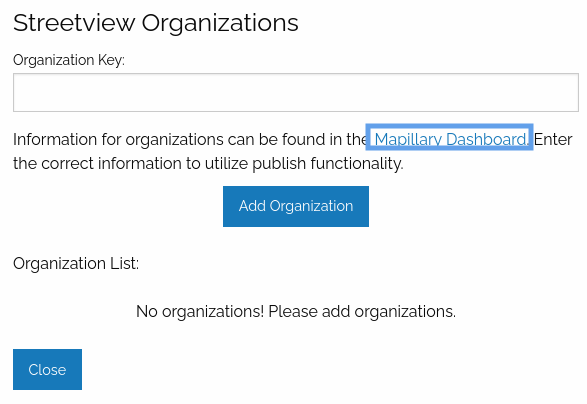
Fig 2.26
These can be acquired through the Mapillary dashboard.
Here, the user will see the username in the top-left panel (Fig 2.27).
In order. to find the organization key, the user must switch to a organization account (Fig 2.28).
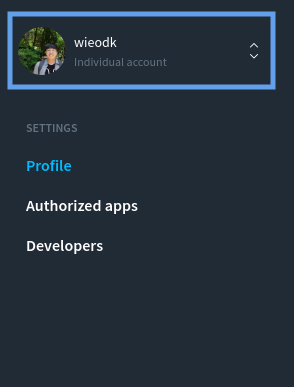
Fig 2.27
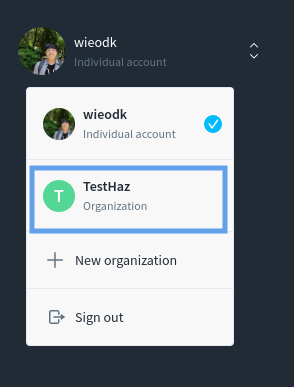
Fig 2.28
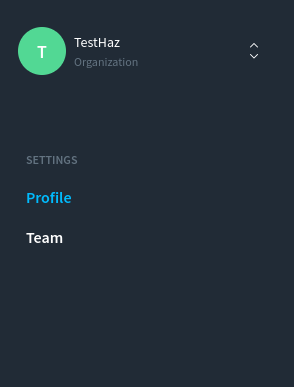
Fig 2.29
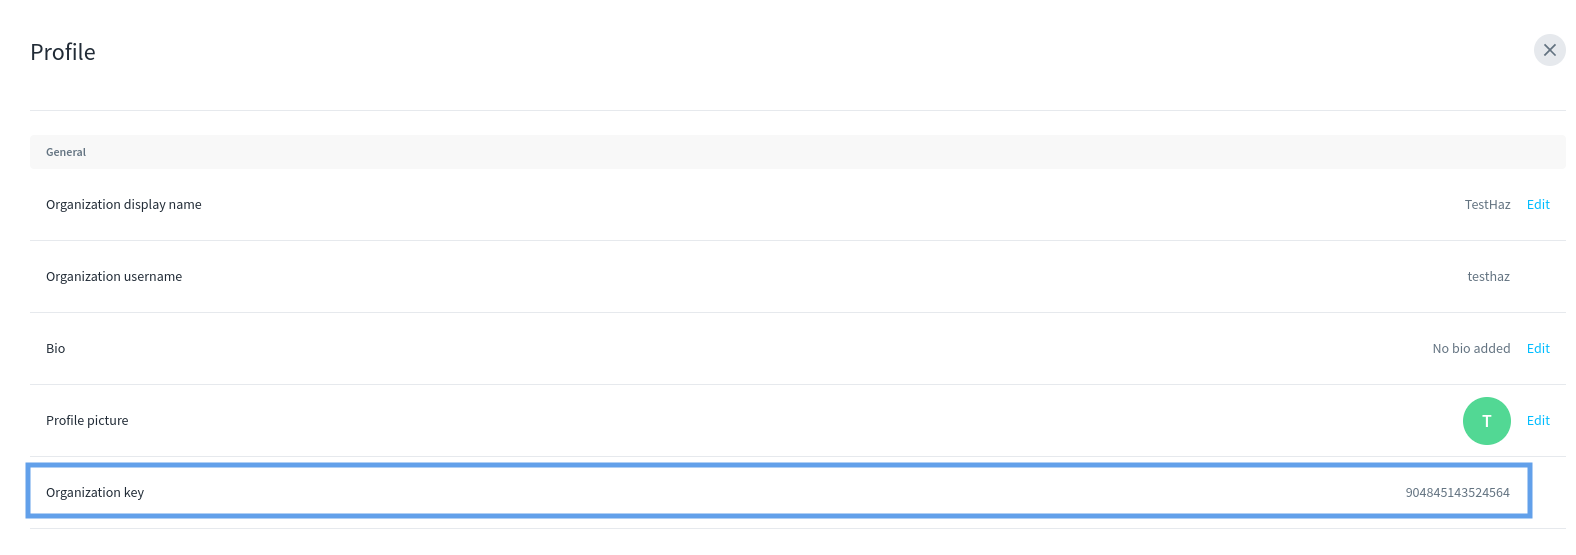
Fig 2.30
If a user adds a correct organization key, Hazmapper will automatically add the organization to the Streetview panel with the organization name. So, users can verify that they've added the correct organization key.
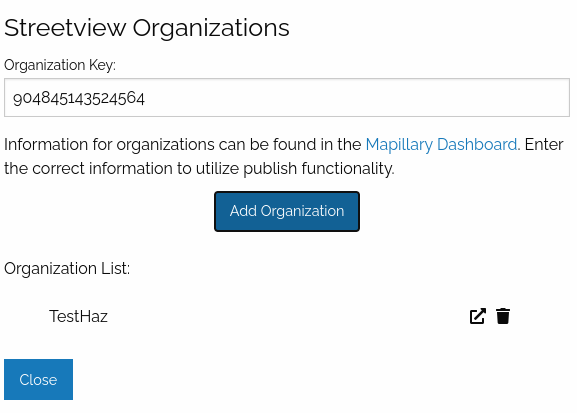
Fig 2.31
Display Mapillary Sequences
This will display all of the mapillary assets of a selected organization in the filters tab.
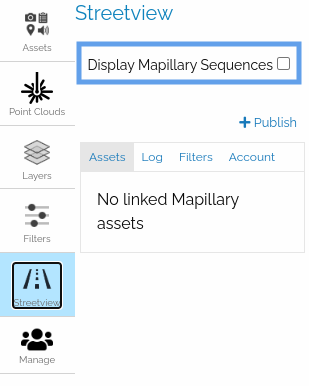
Fig 2.32
Publish Button
This allows the user to upload and publish images from DesignSafe to Mapillary. During the process, the images are linked to hazmapper.
NOTE: The assets published here will be imported as mapillary assets
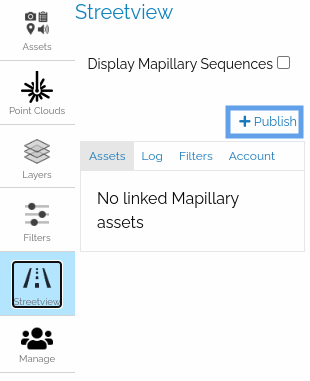
Fig 2.33
On clicking the Publish button, the user will see a prompt that asks for the user to select streetview images (images that support GPano panorama metadata)
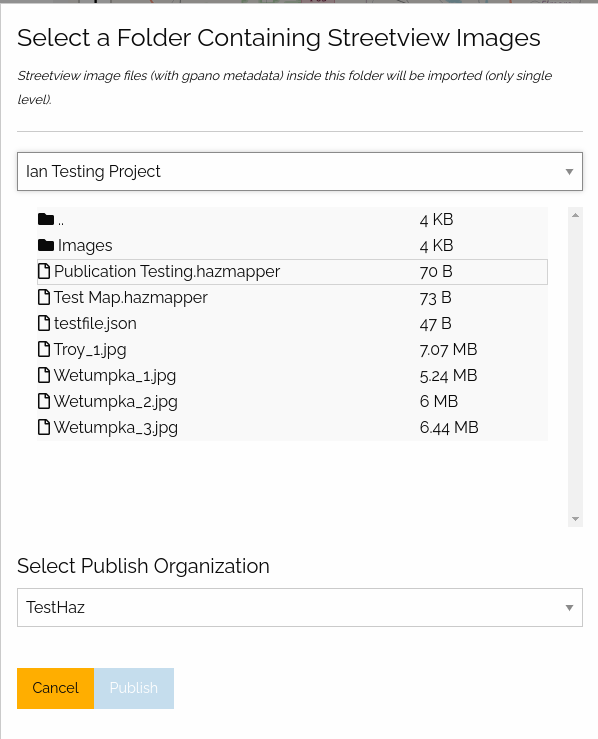
Fig 2.34
Assets Tab
This tab will all of the linked mapillary assets. On clicking on the asset, the prompt will display the mapillary sequences associated with a system/path.
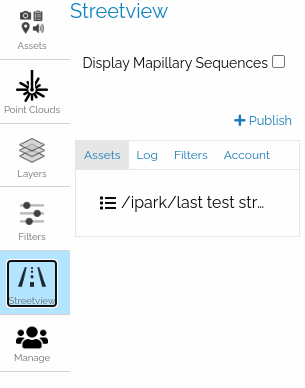
Fig 2.35
In this interface (Fig 2.36), the user can:
- Imported the streetview assets to the map ({: height="12" width="12" }).
- Jump to the sequence in the map.
- Delete the sequence's association with Hazmapper ({: height="12" width="12" }).
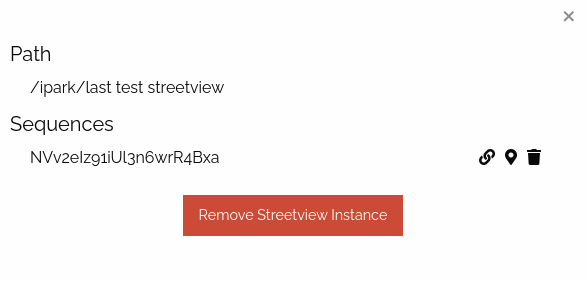
Fig 2.37
Log Tab
The Publish process prompted by the user submitting a publish job requires the images to be first collected from DesignSafe and then published to Mapillary.
This tab shows a list of the progress of active publish processes.
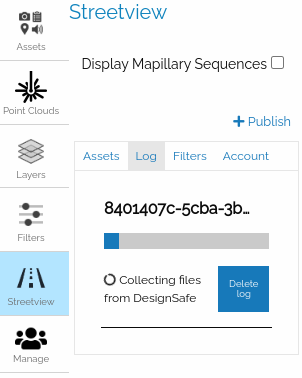
Fig 2.37
Filters Tab
The interface of the Filters tab is similar to that of the Filters panel. However, instead of filtering based on a date range or asset type, this will filter by the organizations that a user added (either on login or through the account tab).
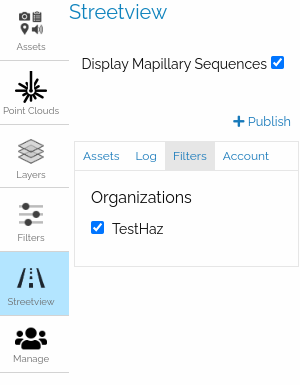
Fig 2.39
Account Tab
The account tab is where the user can view and modify the mapillary account information associated with Hazmapper.
The Logout button will log the user out of the current account.
The Change Username and Manage Organization buttons will each open a prompt similar to the one the user sees on login. They allow the user to modify the account information associated with Mapillary.
The Delete Streetview Service button will delete all of the associations created through publish or link. This operation cannot be reverted! So, the user must be extremely cautious before proceeding. This functionality was implemented so that if the user desires, the user could destroy all of the Mapillary information stored in Hazmapper.
NOTE: Changes here will not affect the actual Mapillary account. For example, changing the username will not change the actual Mapillary username but only change the username that Hazmapper keeps track of.
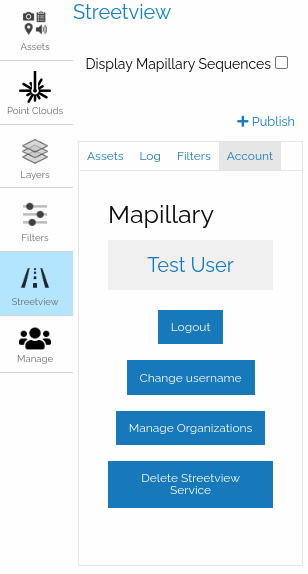
Fig 2.39
Streetview Assets
The streetview support in Hazmapper comes with different asset components.
First, there are some commonalities among the different asset components:
- Right-clicking on the asset on the map will open an information panel on the (Fig 2.40)
- Left-clicking on the asset on the map will open the streetview viewer (Fig 2.41).
- The different types of assets will be displayed in different colors.
- The streetview assets will be displayed as a polyline on the map (Fig 2.40).
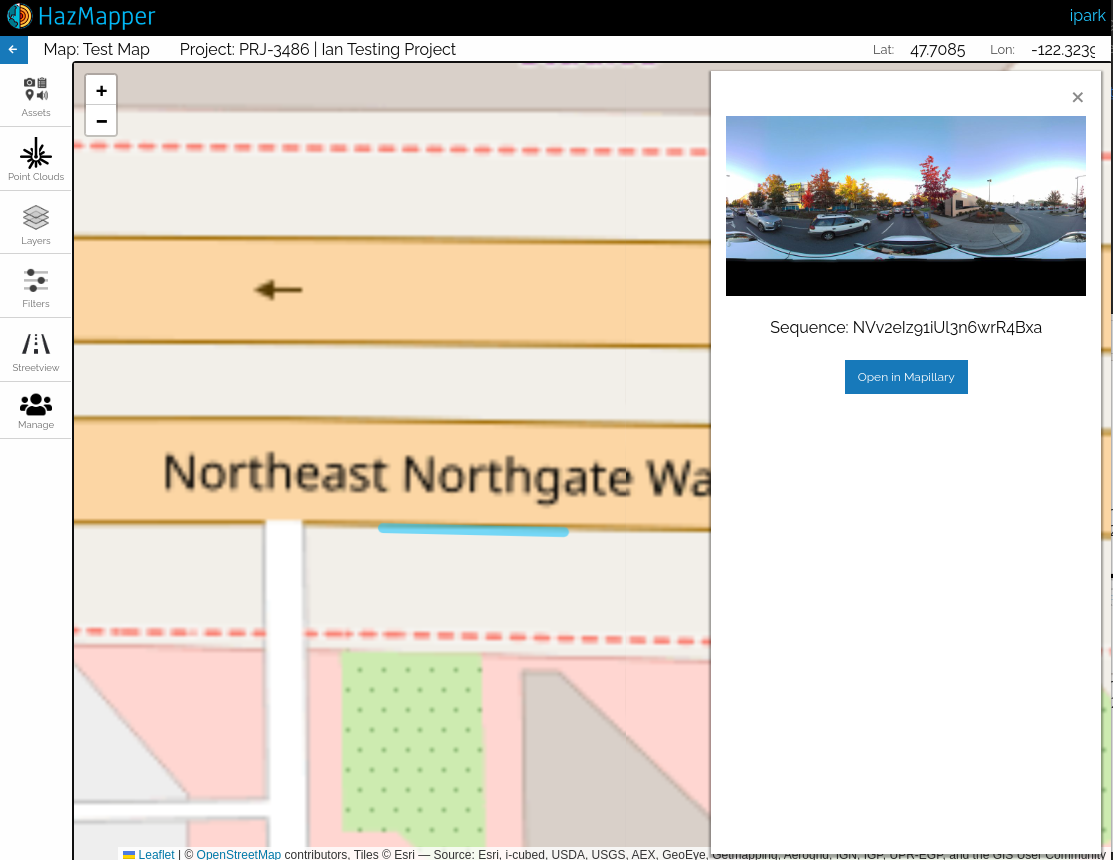
Fig 2.40
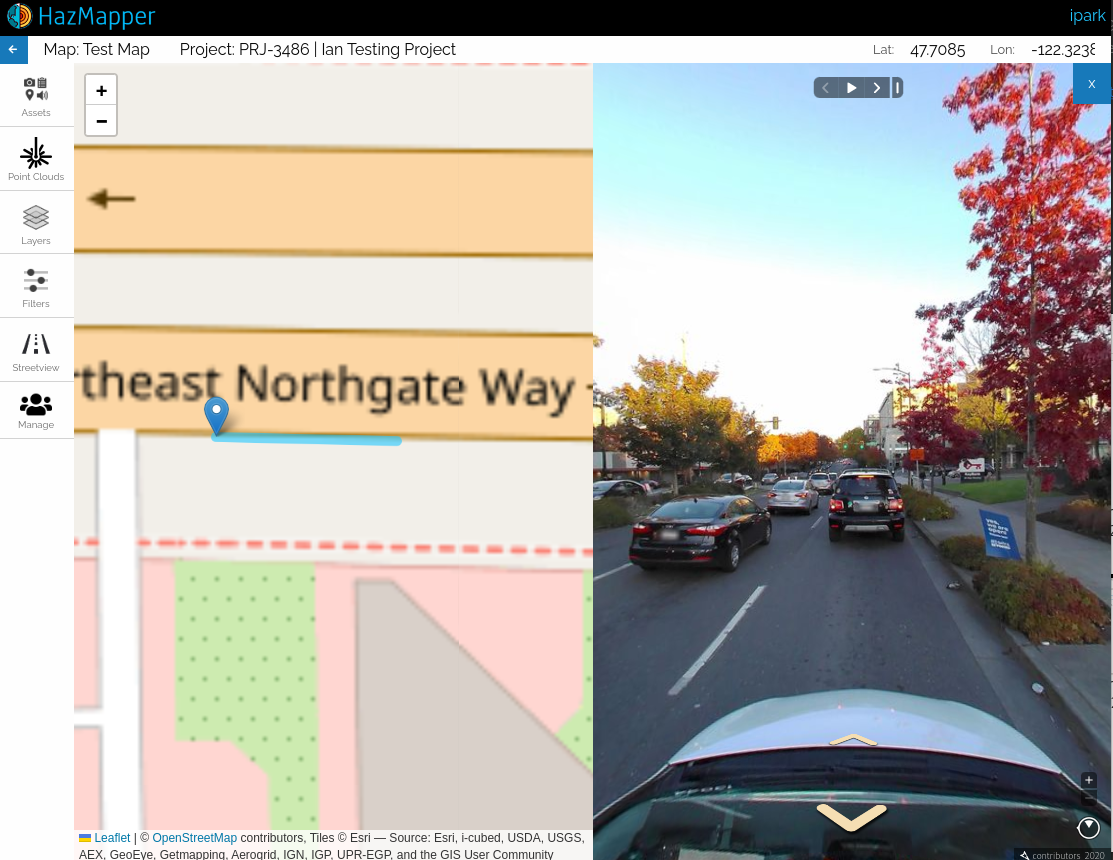
Fig 2.41
Mapillary assets
Because the Mapillary account is tied to an individual user, Mapillary assets are not part of the map itself. Thus, they will not be shown across members of the map and those with access to the public version of the map.
These are the assets under an organization that can be added through the Account or when logging in tab and can be filtered by organizations with the Filters tab. The only association they have will be through the organization.
They are displayed in this color: .
To link the assets to Hazmapper, the user must right-click on the asset to open the info panel (Fig 2.42). From there, the user can click on the Link sequences to Hazmapper button.
This will open a modal, in which the user can select a location to link the sequence asset to (Fig 2.43).
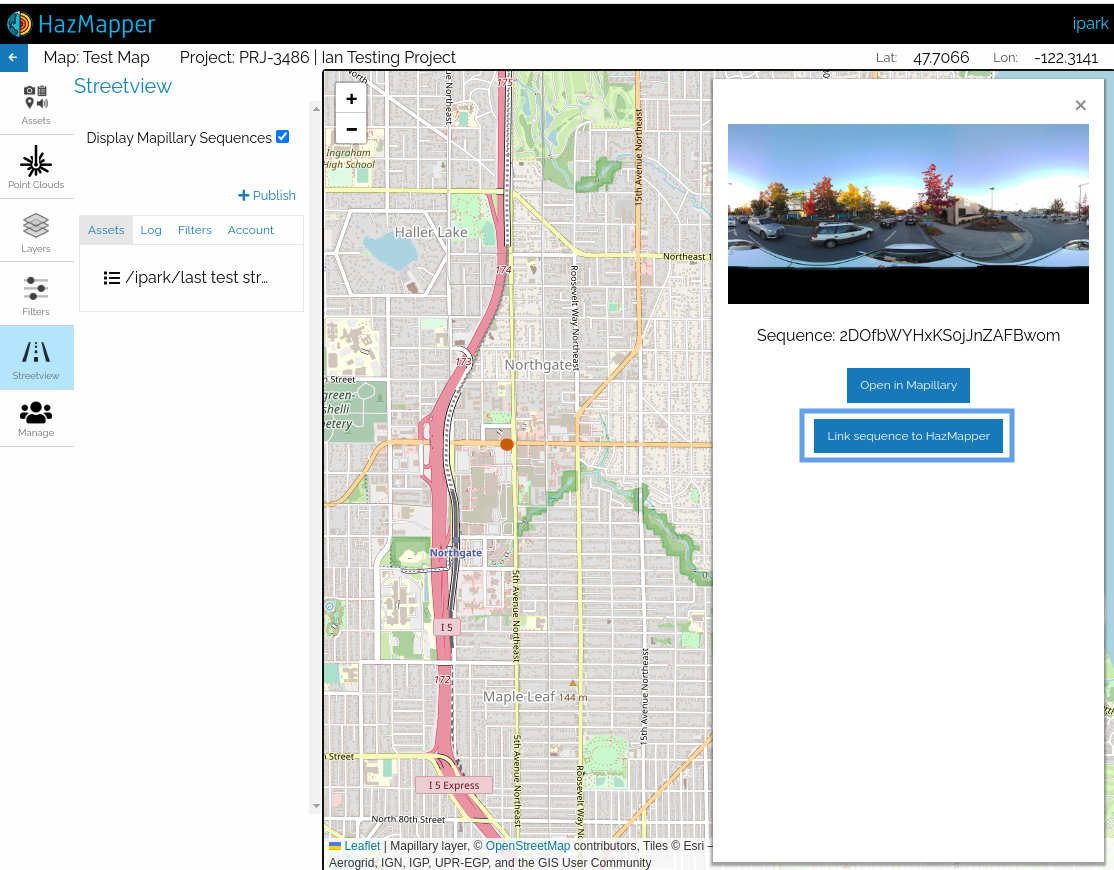
Fig 2.42
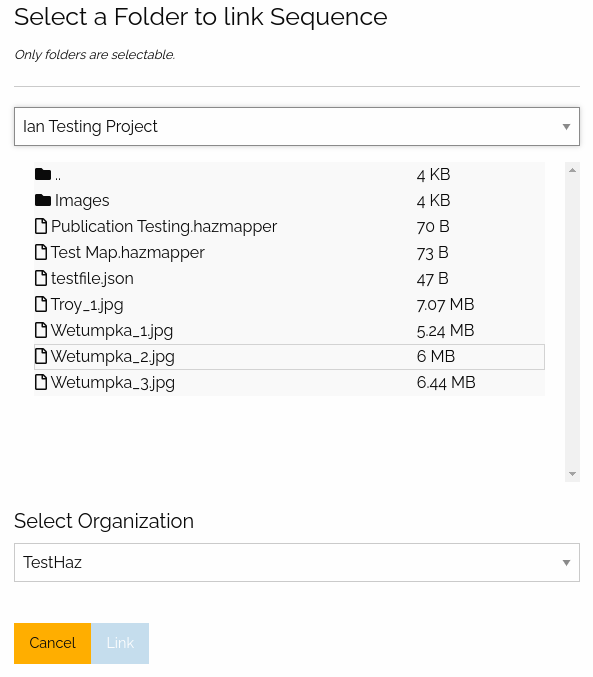
Fig 2.43
These are created either by manually adding a link from a non-linked mapillary asset or publishing streetview assets to Mapillary through Hazmapper.
They are displayed in this color: .
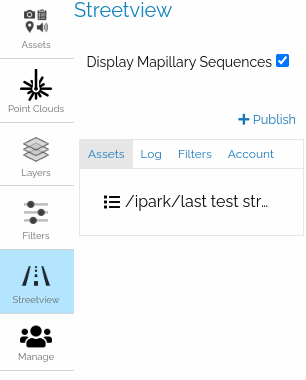
Fig 2.44
Imported streetview feature assets
Although the user is required to log in to the Mapillary to utilize them, imported streetview assets are part of the map. Thus, unlike mapillary assets, they can be shared among the members of the map and with those with access to the public version of the map.
They appear in the Hazmapper assets panel.
They are displayed in this color: .
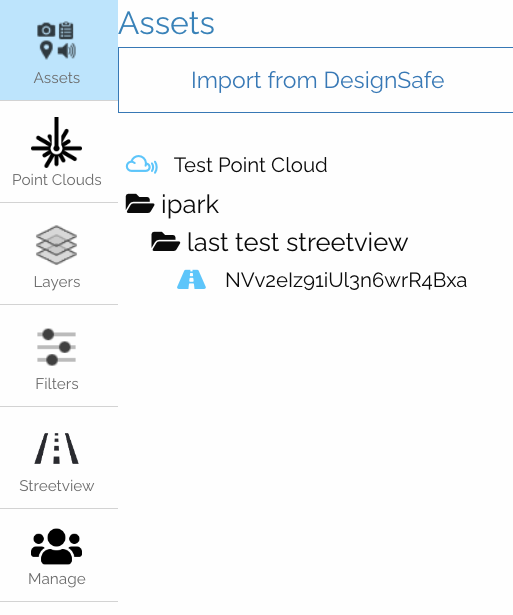
Fig 2.45
Manage Panel
In this panel, the user can manage the configuration of the maps.
The Map tab allows the user to edit the name/description of the map and delete the map.
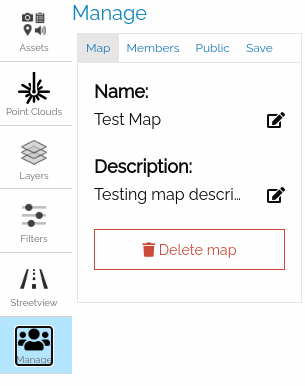
Fig 2.46
The Members tab allows the user to view other users with access to the map (these will be managed by the linked DesignSafe Project.
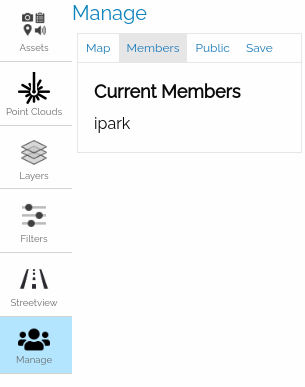
Fig 2.47
The Public tab allows the user to create a public version of the map by creating a permanent link that can be shared with anyone. (Fig 2.48).
The public map will have access to all of the map-associated assets (Fig 2.49). However, none of the editing functionality will be provided.
After making the map public, the user can either click or copy the link. Furthermore, the user can revert the process and make the link private again (Fig 2.50).
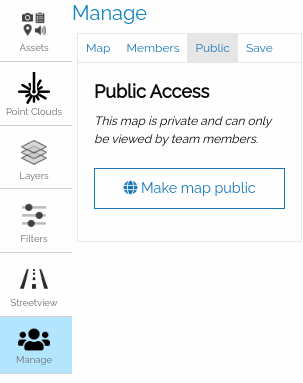
Fig 2.48
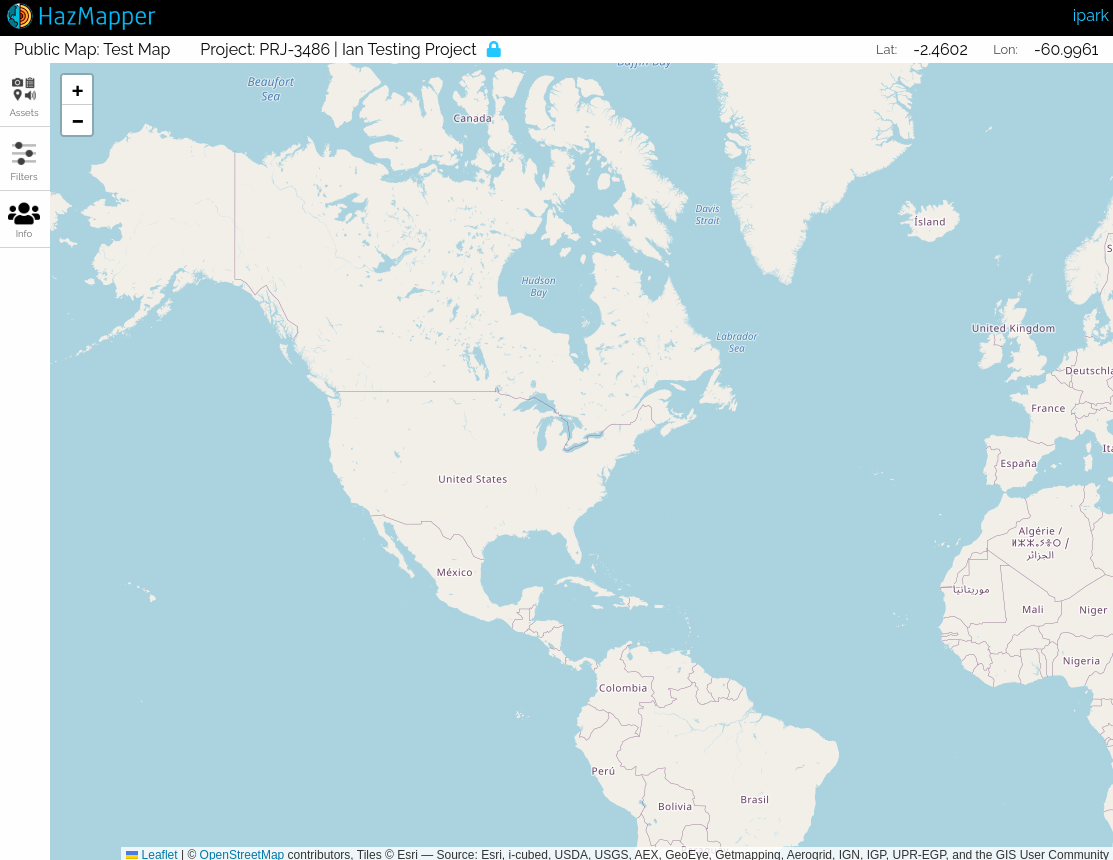
Fig 2.49
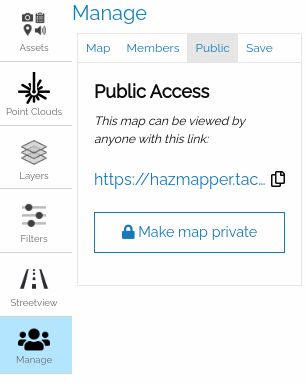
Fig 2.50
The Save tab shows where the map is saved within DesignSafe's Data Depot. If saved to a DesignSafe project, it will display the corresponding project information.
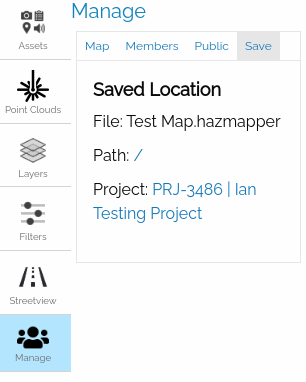
Fig 2.51
Maps
Map
A map is the equivalent of projects in some apps (not to confuse with DesignSafe Projects). They are the basic unit of work.
When creating a new map, the user is required to save the map to a location in DesignSafe. If saved in the Data Depot, the user creating the map will be the sole owner of the map with edit capabilities (import, delete, rename, etc). Otherwise, if saved to a DesignSafe project location, the users of the project will also have the right to edit the map.
If saved to a DesignSafe project, the DesignSafe project interface will also show this association.
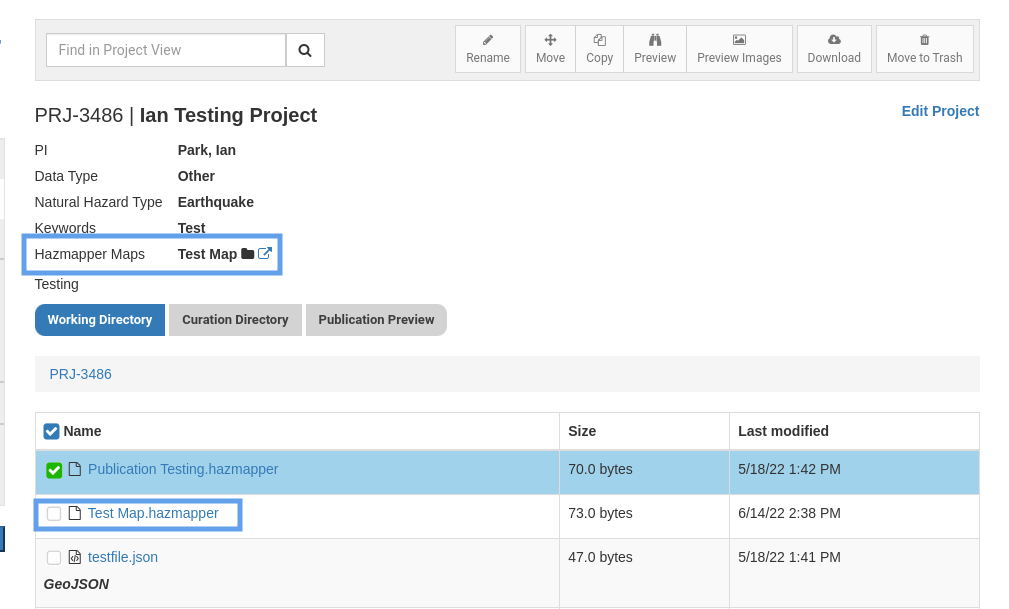
Fig 3.1
Public Map
An owner of a map can create a "Public Map" by creating one in the Manage -> Public (tab) -> (icon) Make a public map. The user can open the map by clicking on the generated link. When clicking on the (icon) copy icon, the URL address of the public icon will be available.
A public map is meant to be a permanent link to the project unless the project itself is deleted. Thus, one must be careful of deleting the underlying project after sharing a link to the map.
Syncing Map
If the user checks the "Sync Folder" checkbox on creating the map, the map will sync all the assets from the chosen save location. So, all the assets will be imported. Whatever asset the user import to the location from DesignSafe will automatically be imported.
To check the discrepancies Hazmapper will start the import job periodically.
Supported Asset Types
Map Associated Assets
Media Assets
Currently, we support the following media assets. Note that these assets must have geospatial data (lat/lon) for Hazmapper to properly process and handle them. If the image is problematic, Hazmapper should show an error during the import process.
- Image Assets: jpeg, jpg, png
- Video Assets: mp4, mov, mpeg4, webm
- GeoJSON/Shapefiles
Point Cloud Assets
Point cloud assets are represented as bounding boxes showing their respective geographic locations.
They can be analyzed further through the Potree Viewer, which shows a 3D model of the point cloud.
Imported Streetview Assets
These are imported versions of mapillary streetview assets and bound to the map (different from non-imported streetview assets shown and accessed through the Streetview panel).
Thus, they can be shared among users of the map and with those who have access to the public link map if the map has a public version.
Tile Layers
These are tile layers from an external tile server. They are managed through the Layers panel.
Currently, supported formats are:
- TMS
- WMS
- ArcGIS Tile Server
.inifile containing tms/wms information- Formats accessible through Quick Map Services
NOTE: Tile layers are not regular Feature Assets (i.e. they do not show up in the assets panel), but they are part of the map and can be shared among collaborators and those with access to the public version of the map.
Third-party Assets
Non-imported Streetview Assets
These are supported through a Mapillary's tile service. Because these are user-dependent services, they cannot be shared among users of a map. Thus, they must be imported as imported streetview assets
Collaboration
Shared Maps
As briefly mentioned in the Maps section, maps that are saved in the DesignSafe project will be shared among the members of the project. These maps will automatically display in the welcome menu. Because of the connection, the addition/deletion of members is also managed by each corresponding DesignSafe project.
Public Maps
Any map can have a public version of the map through the public tab of the manage panel. The generated link will be permanent unless the owner of the map makes the map private, or unless the owner of the map deletes the original map.
Kalpana User Guide
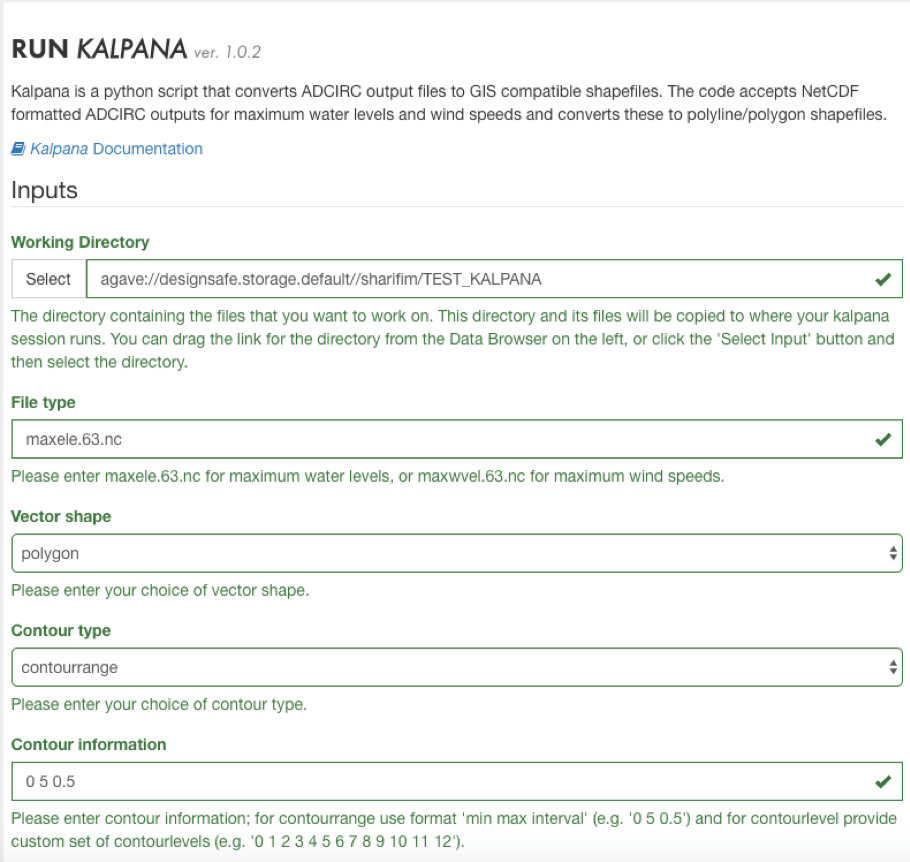
Kalpana is a python script that converts ADCIRC output files to GIS compatible shapefiles. The code accepts NetCDF formatted ADCIRC outputs for maximum water levels and wind speeds (maxele.63.nc and maxwvel.63.nc) and converts these to polyline/polygon shapefiles.
More information regarding Kalpana can be found at: https://ccht.ccee.ncsu.edu/how-to-run-kalpana/.
How to Submit a Kalpana Job in the Workspace
You will have to fill out a form to submit your job that asks multiple information as follows:
- Working Directory:
This is the directory that contains the ADCIRC simulation NetCDF file to be converted. You can either drag and drop the directory from Data depot browser on the left or use select button.
- File type:
The Kalpana software on DesignSafe is capable to convert two NetCDF file types.
(a) maxele.63.nc for maximum water levels,
(b) maxwvel.63.nc for maximum wind speeds.
- Vector shape:
Vector shape can be selected from a dropdown menu to be (a) polyline or (b) polygon.
- Contour type and Contour information:
If you select contourrange for contour type, the contour information should be provided in this format 'min max interval' (e.g. '0 5 0.5').
If you select contourlevel for contour type, the contour information should be provided as a custom set of contour levels (e.g. '0 1 2 3 4 5 6 7 8 9 10 11 12'). Please note that the selection of contour values depends on the range of your simulation output.
Next enter a job name and an output archive location or use the default provided. Now, click Run to submit your job.
You can track the status of your job to the right side of the same page. The status will change from “Pending” to “Staged”, “Submitting” and “Running”. These processes usually take about 1 to 2 minutes.
Once the status changed to “FINISHED”, you can find the outputs in data depot by navigating to the archived location. If not specified by the user, the job output including the converted shapefile can be found at: My Data / archive / jobs / ${YYYY-MM-DD} / ${JOB_NAME}-${JOB_ID}
Paraview User Guide
ParaView is an open-source, multi-platform data analysis and visualization application. ParaView users can quickly build visualizations to analyze their data using qualitative and quantitative techniques. ParaView was developed to analyze extremely large datasets using distributed memory computing resources. Using ParaView in the Workspace, you will be running interactively in a GUI.
More detailed information and ParaView user documentation can be found on the ParaView website.
How to Start a Paraview Interactive Session in the Workspace
- Select the ParaView application from the Visualization tab in the Workspace.
- Locate the directory containing your data files in the Data Depot and follow the onscreen directions to enter this as your Working Directory.
- Select your desired desktop resolution from the dropdown menu.
- Enter a maximum job runtime in the form. See guidance on form for selecting a runtime.
- Enter a job name.
- Enter an output archive location or use the default provided.
- Select the number of nodes to be used for your job. Larger data files run more efficiently on higher node counts.
- Click Run to start your interactive session.
- Be sure to exit the Paraview application when you are finished with the session or any files saved will not be archived with the job.
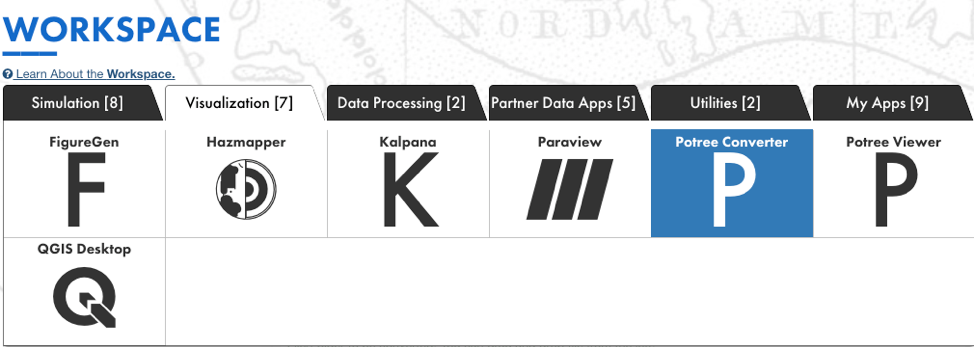
Potree Converter User Guide
The Potree Converter converts point clouds to a format compatible with the Potree Viewer. Several options are available for you to customize your conversion, and can be found on the Potree Converter Github site.
POTREE Converter can be found under Visualization tab in DesignSafe Workspace. This application converts non-proprietary point cloud data formats (e.g. las, laz, binary ply, xyz or ptx) to a POTREE readable data structure (octree). The output directory from this application can next be visualized in POTREE Viewer.
How to Submit a Potree Converter Job in the Workspace
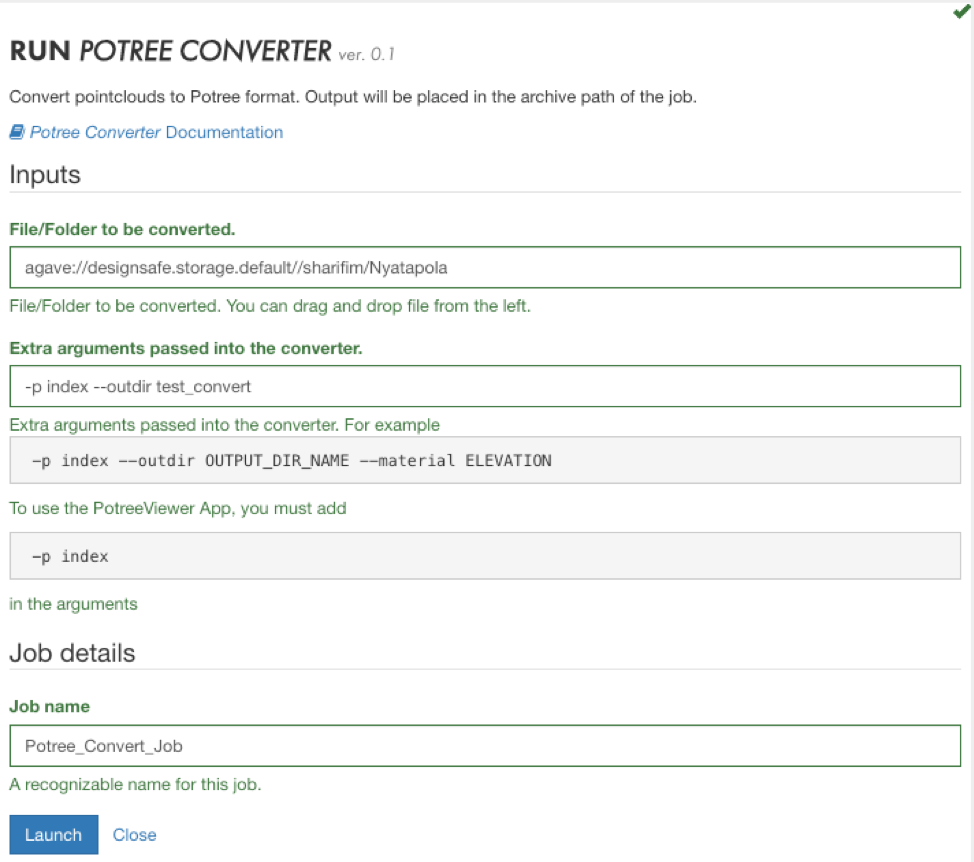
Similar to most applications in DesignSafe, you will have to fill out a form to submit your job that asks for following information:
- File/Folder to be converted:
You can simply drag and drop either a file or a folder containing multiple point cloud files from Data Depot Browser (to the left of this form) in this place. - Extra arguments passed into the converter:
“-p index” should be passed as a minimum in this section. This creates a html index file which is necessary for POTREE viewer to run. Additionally, you will be able to pass more arguments. For instance, you can type the name of the output directory shown as below -p index –outdir OUT_DIR_NAME. Please note that the output directory will be placed in “MyData.” - Job name:
You will need to provide a recognizable name for this job.
The job log files will be stored at archive folder in “Mydata”: {username}/archive/jobs/${YYYY-MM-DD}/${JOB_NAME}-${JOB_ID}
When the form is completed, you can click “Launch” to submit your job. The job status can be monitored to the right of this form. It will change from “Pending” to “Staged”, “Submitted” and “Running” before it is successfully “Finished.”
FAQ
- My job’s status will change swiftly from Running to Finished with no converted output directory?
This most likely means that the process is not completed and the job is failed. This is usually as a result of the presense of special characters (e.g. * ^, !, $, % and etc.) in your input file or directory. Please re-submit a job after removing these characters by renaming the input files or directory. If the problem persists, please submit a ticket for further assistance. - I want to convert a file/folder located in My Projects. What should I do?
From the Data Depot Browser to the left of job submission form, you can browse to your desired project and select the file/folder to be converted.
Potree Viewer User Guide
Potree Viewer is a point cloud viewer that enables exploration and measurement of very large LiDAR datasets and is designed to be efficient in a web browser. Use the Potree Converter to first convert your point cloud data to a format compatible with the Potree Viewer.
How to Start a Potree Interactive Session in the Workspace
- Select the Potree Viewer application from the Visualization tab in the Workspace.
- Locate the folder containing your data files in the Data Depot and follow the onscreen directions to enter this folder into the form.
- Enter a maximum job runtime in the form. While this field is required in the form it is not actually used, simply enter any time using the time format shown.
- Enter a job name.
- Enter an output archive location or use the default provided.
- Click Run to start your interactive session.
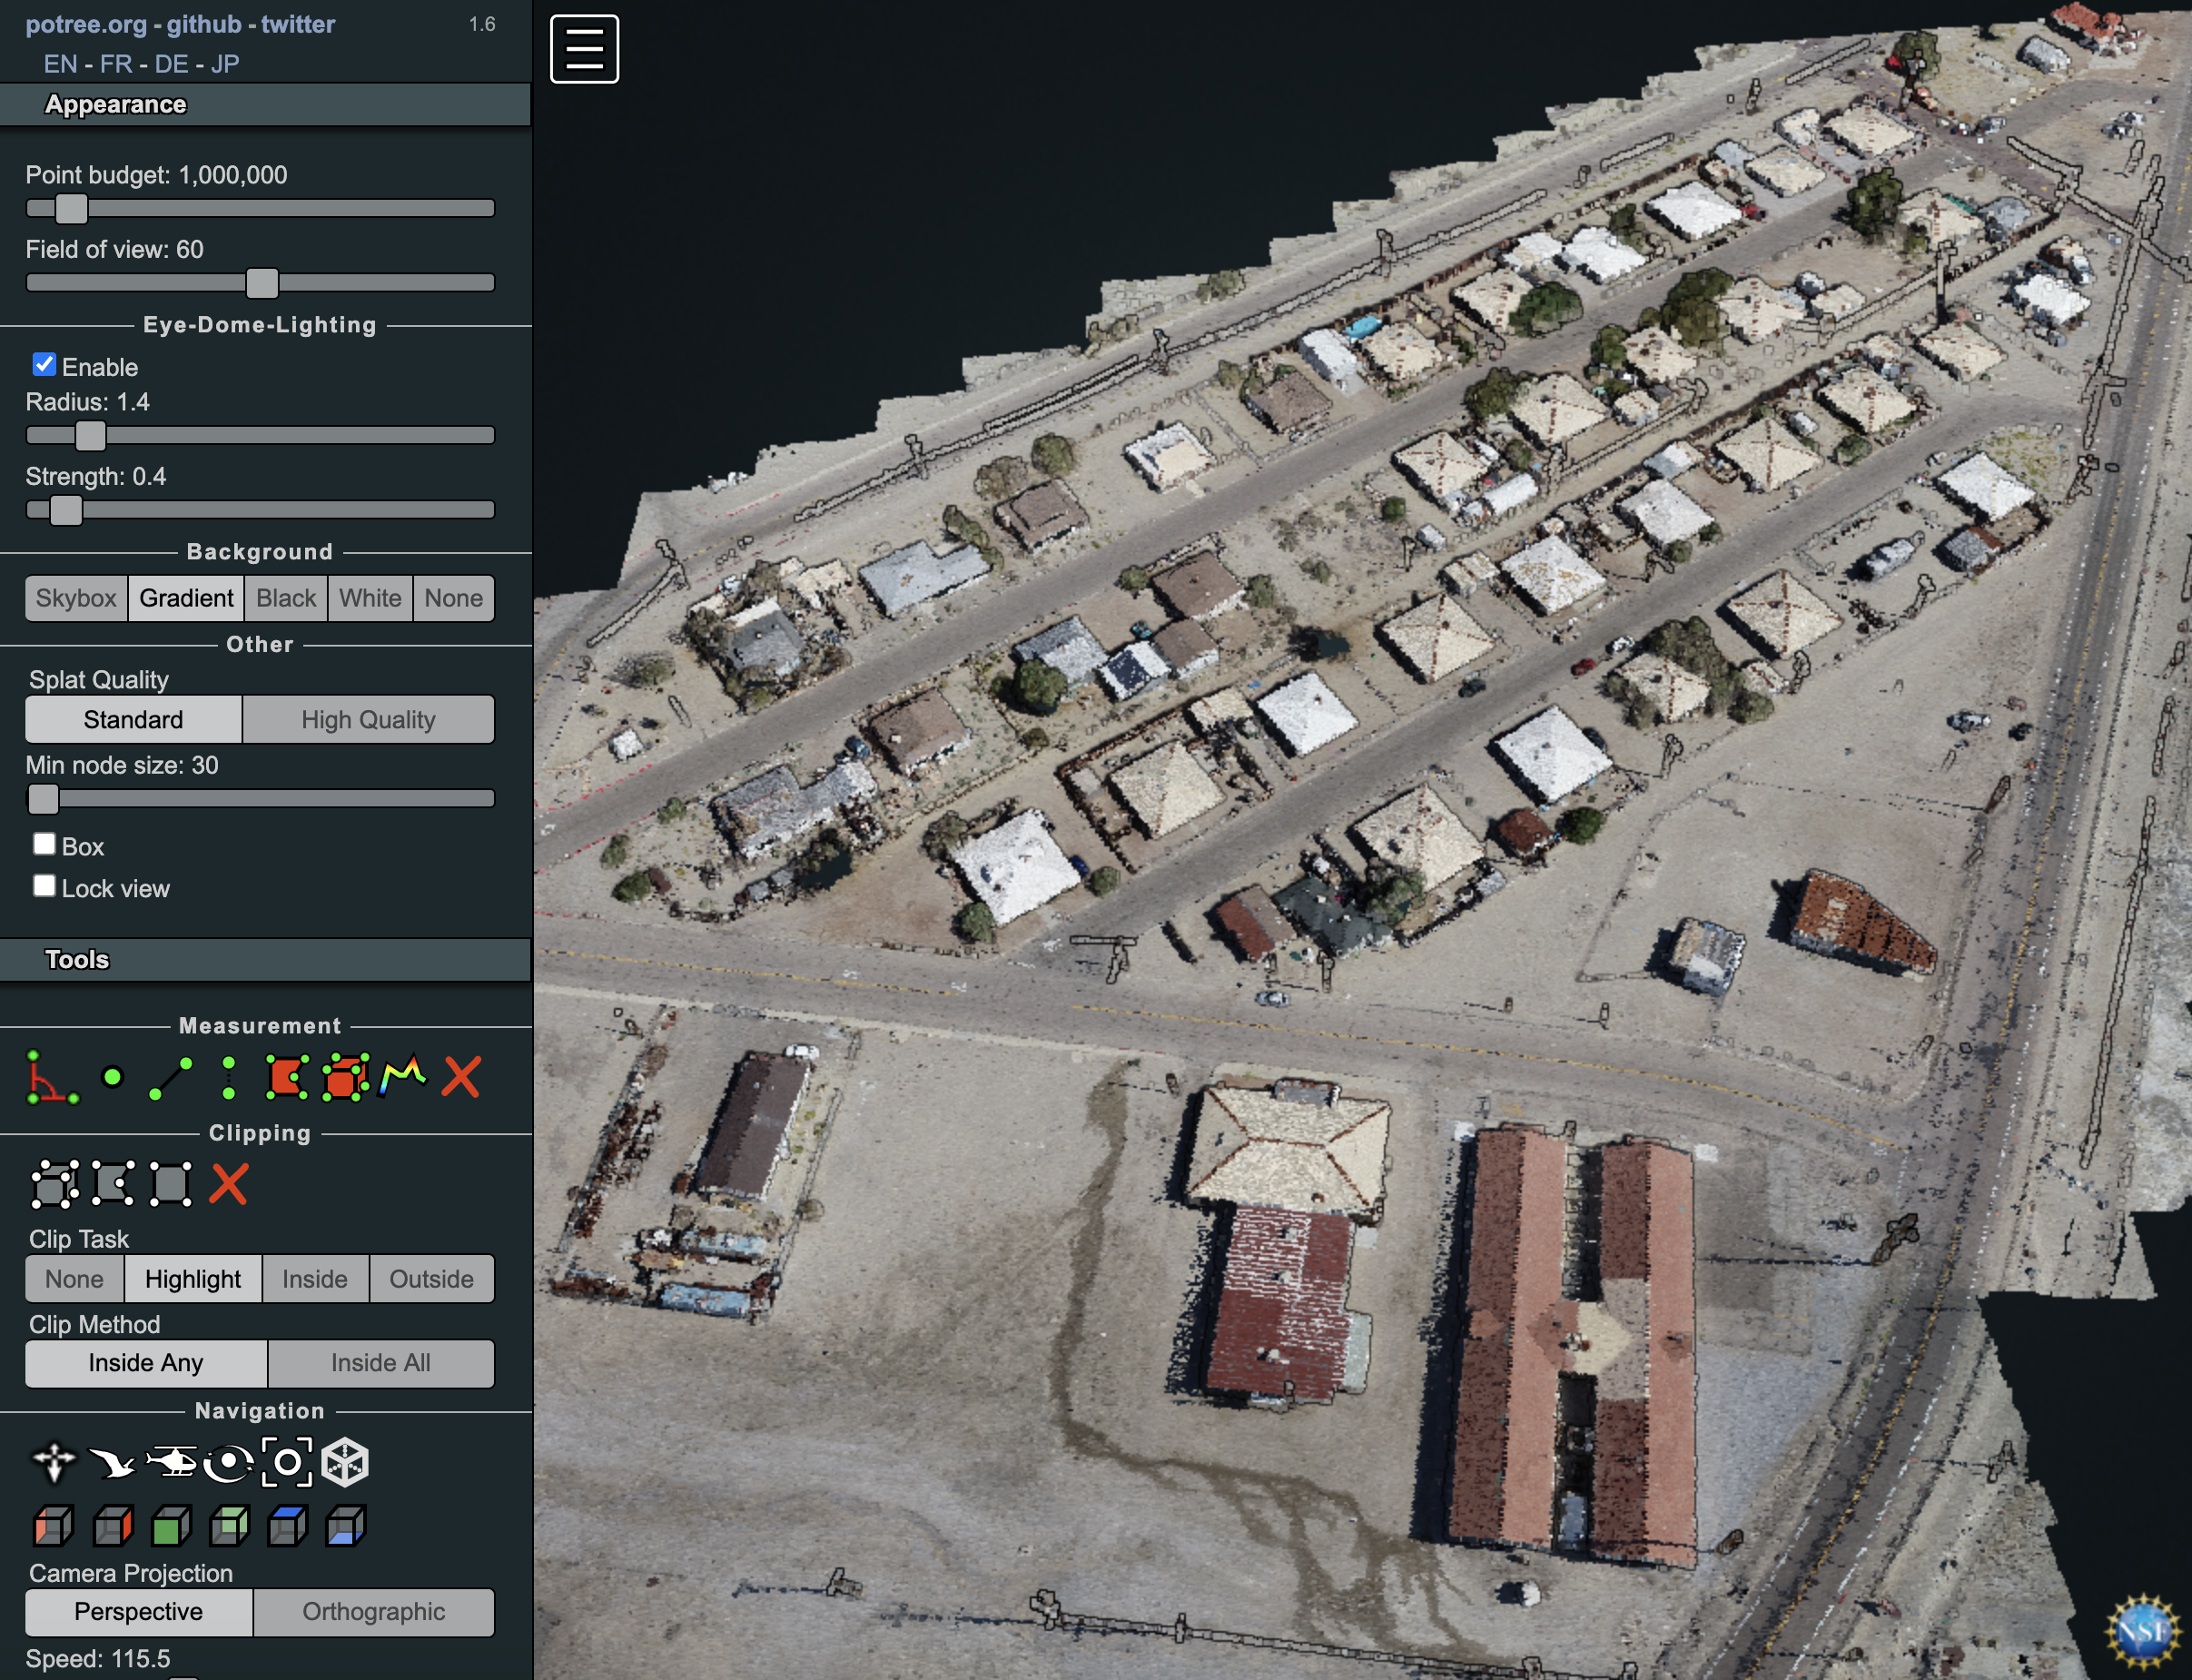
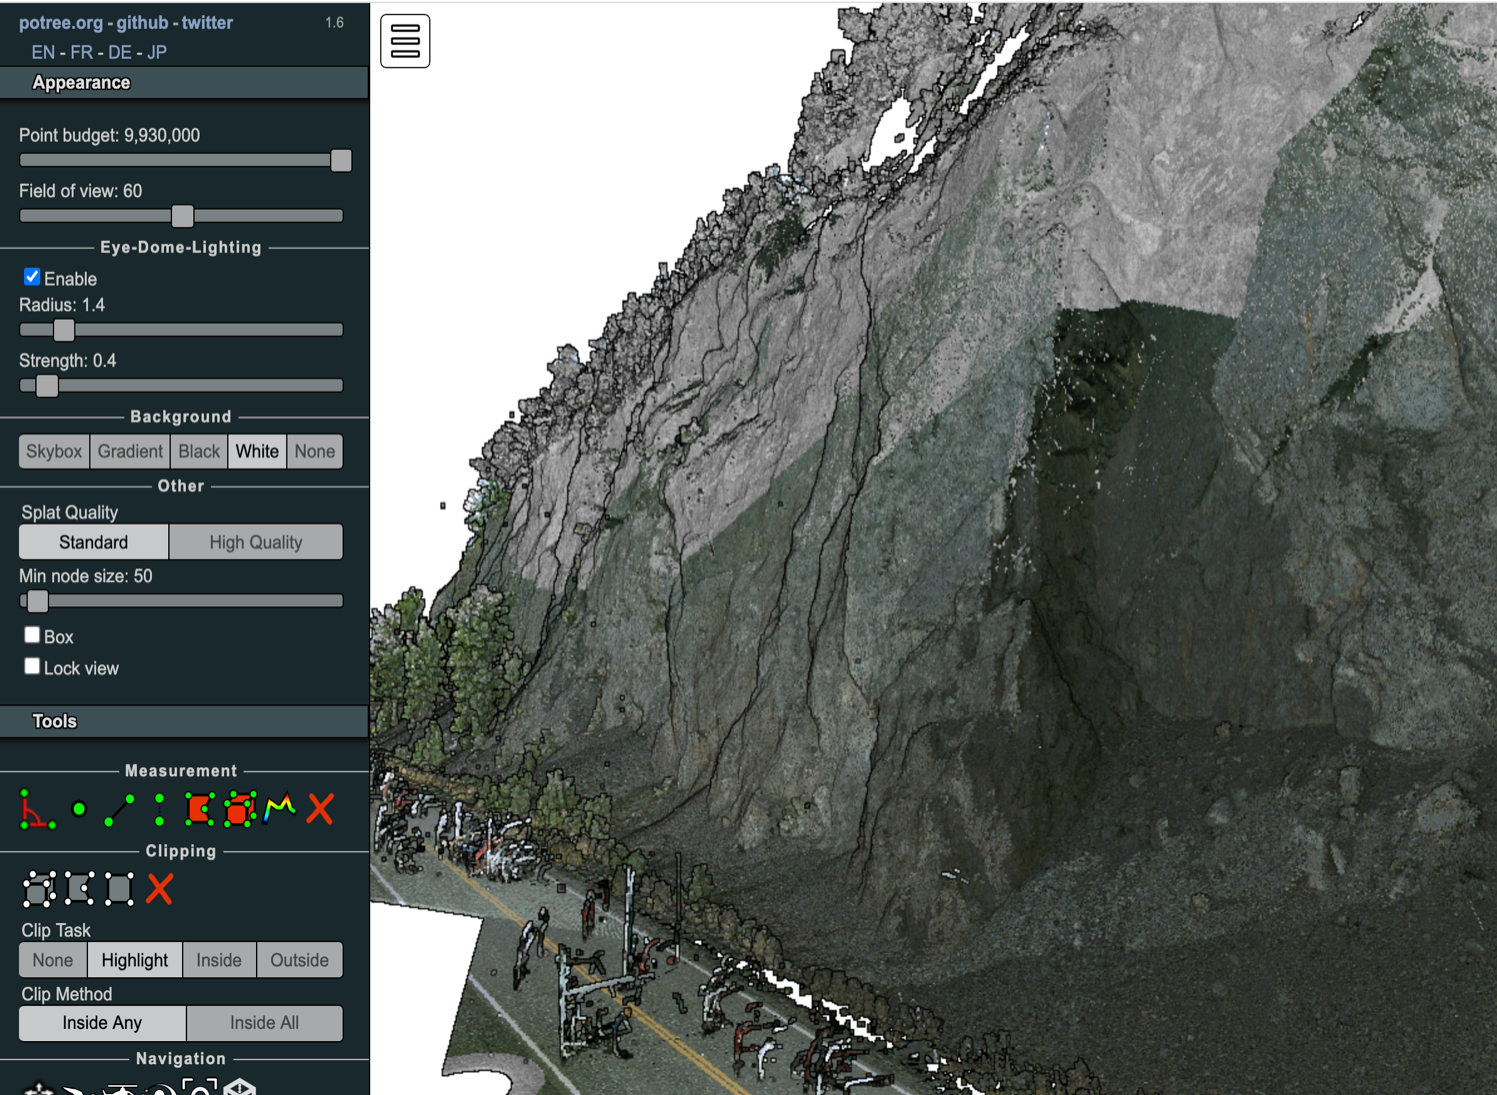
General Potree Viewing Instructions
You can upload the data, run the Potree converter and then create a Potree Viewer website where you can view the data in your web browser (Best with Chrome). Here are some examples you can explore:
(1) RidgeCrest Earthquake Fault Rupture - (DOI: https://doi.org/10.17603/ds2-wfgc-a575)
https://agave.designsafe-ci.org/geo/v2/assets/72/961e37b1-a0ac-47b9-9161-b977c0eb92e5/index.html
https://agave.designsafe-ci.org/geo/v2/assets/72/077e6d23-930b-4b20-9c04-f7c92503f751/index.html
(2) Alaska Anchorage Rockslope - (DOI: https://doi.org/10.17603/ds2-jmfv-9171)
https://agave.designsafe-ci.org/geo/v2/assets/104/cfc136e1-e91c-40d2-8d8e-c010da0f9656/index.html
(3) SfM Point Cloud (University of Washington Campus):
https://agave.designsafe-ci.org/geo/v2/assets/80/8f4c3c75-a0b0-44f1-a858-e1949802cf6e/index.html
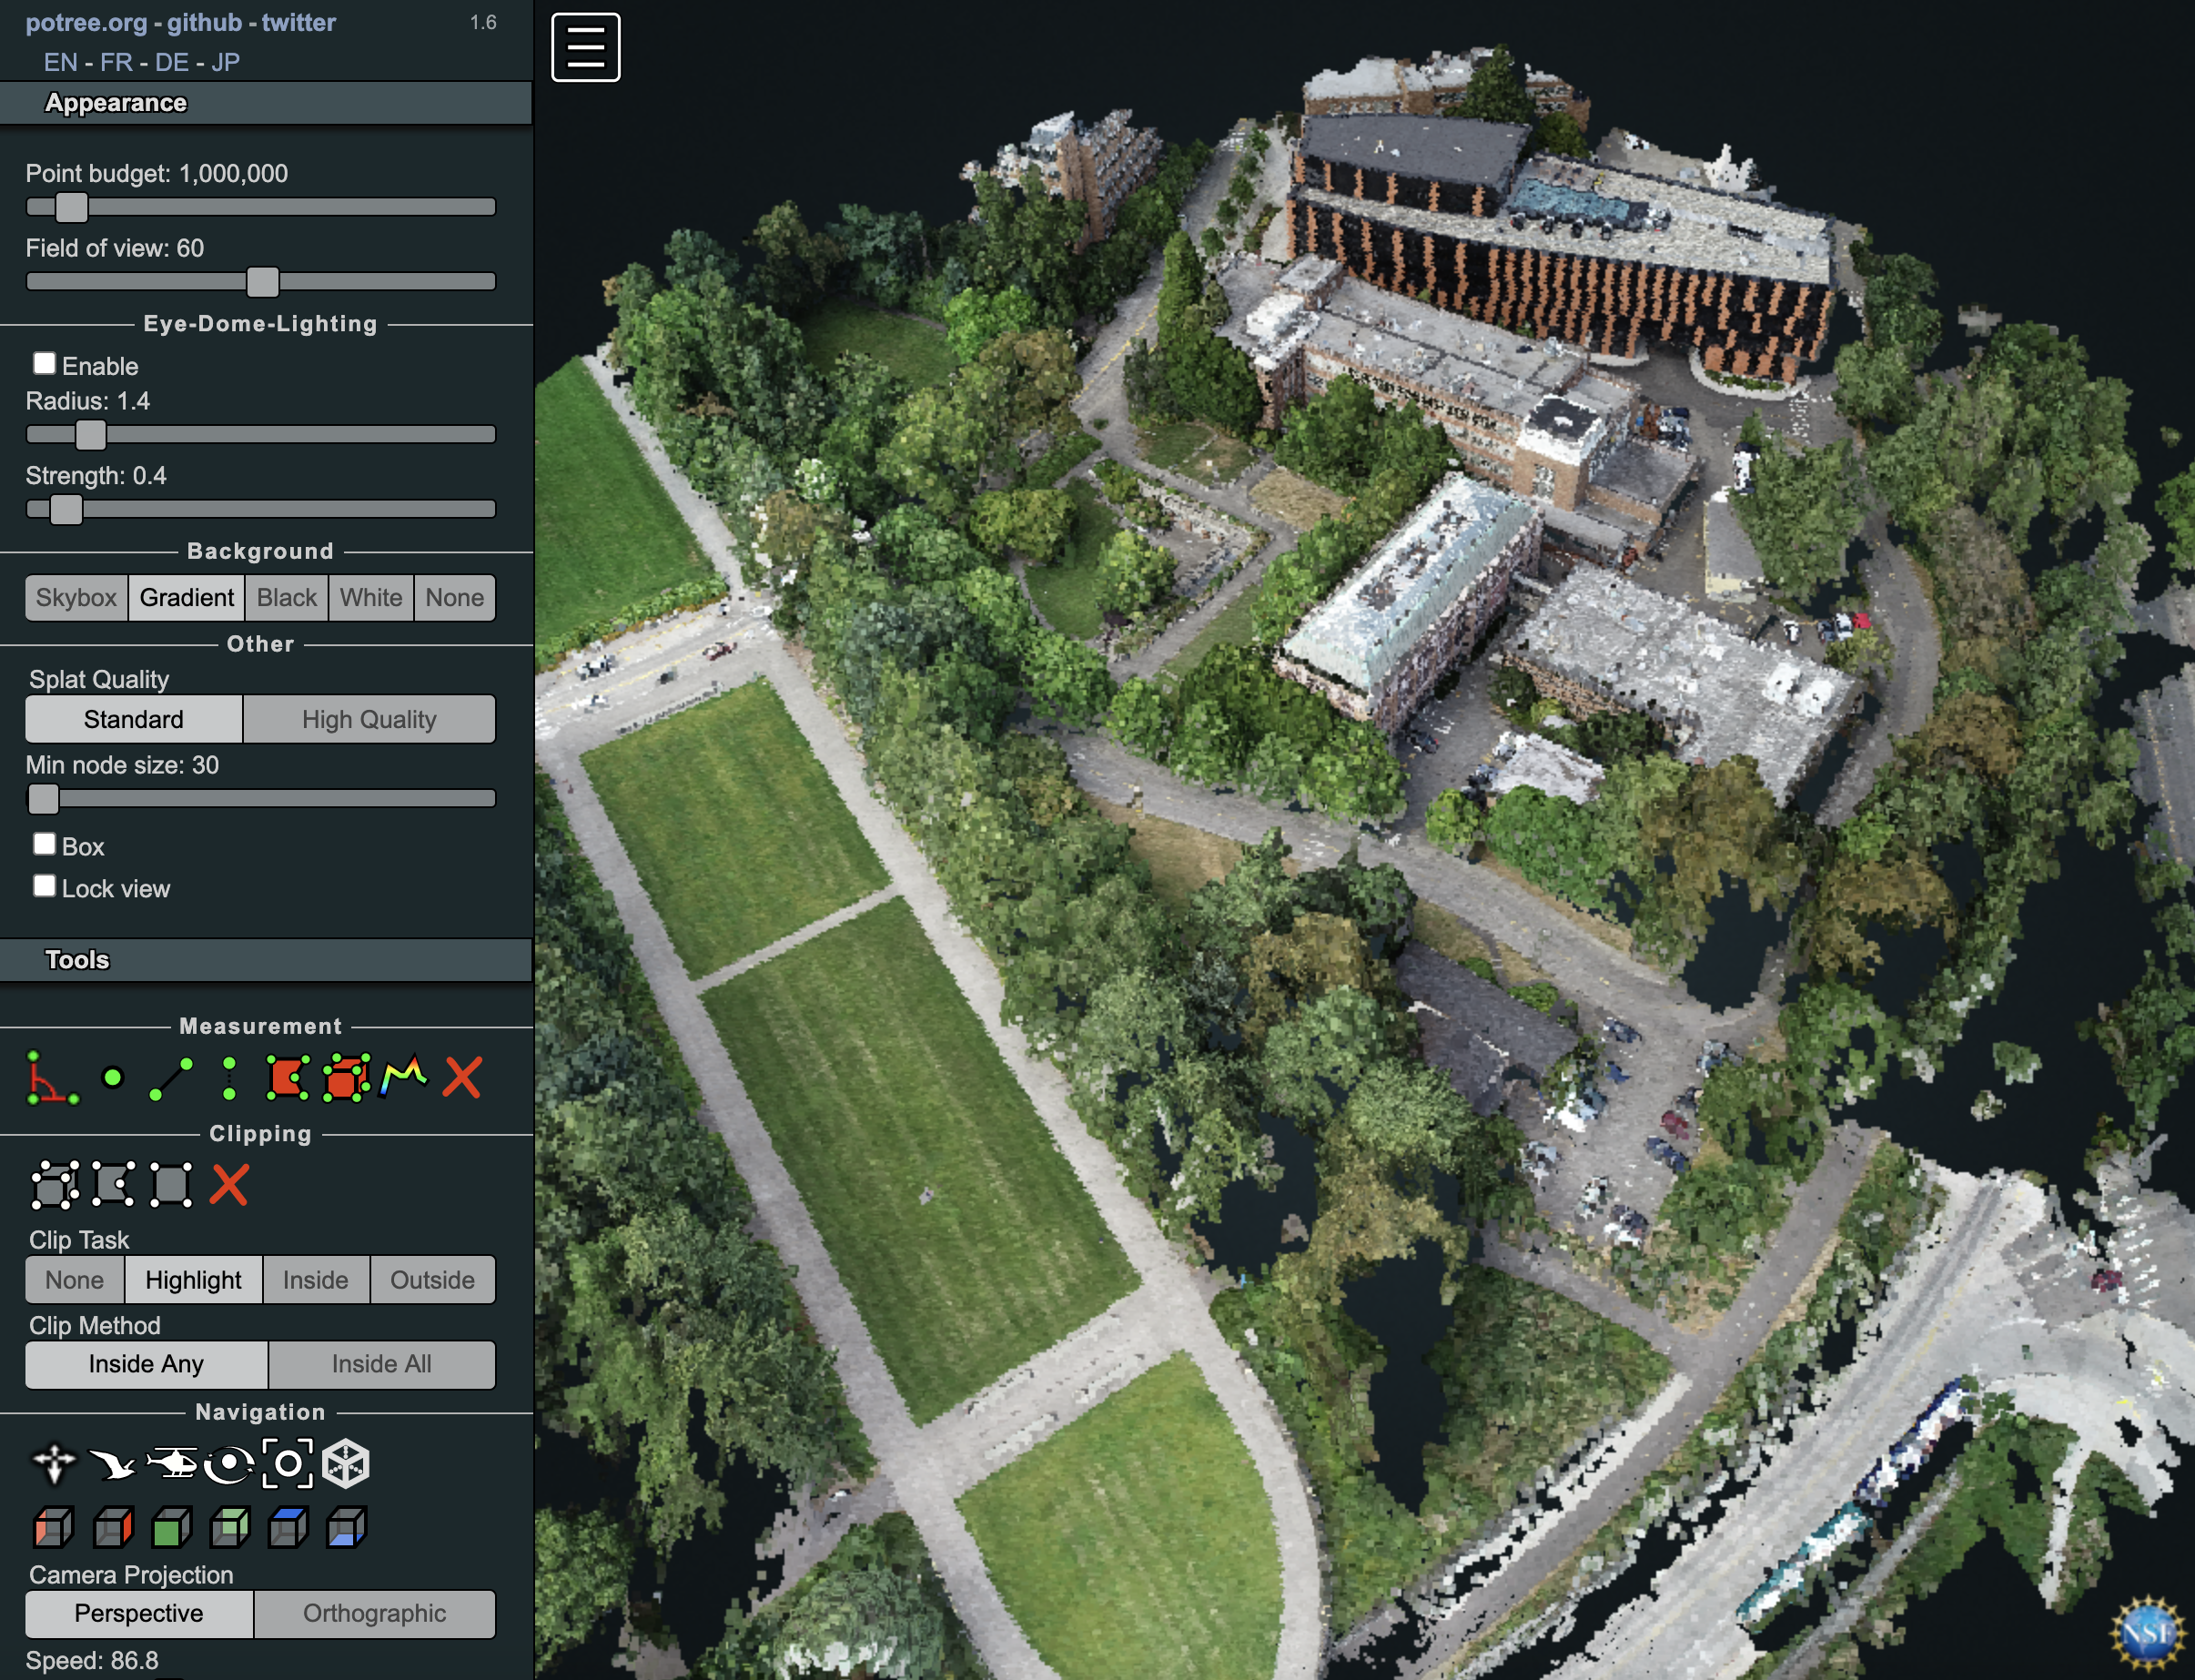
Note for best viewing, be sure to turn on eye dome lighting in the appearance tab and increase the point budget. You can also change the coloring of point clouds by clicking on index under object which will bring various coloring objects under attribute menu. For instance, you can select "Elevation" and set the minimum and maximum range for a coloring scheme.
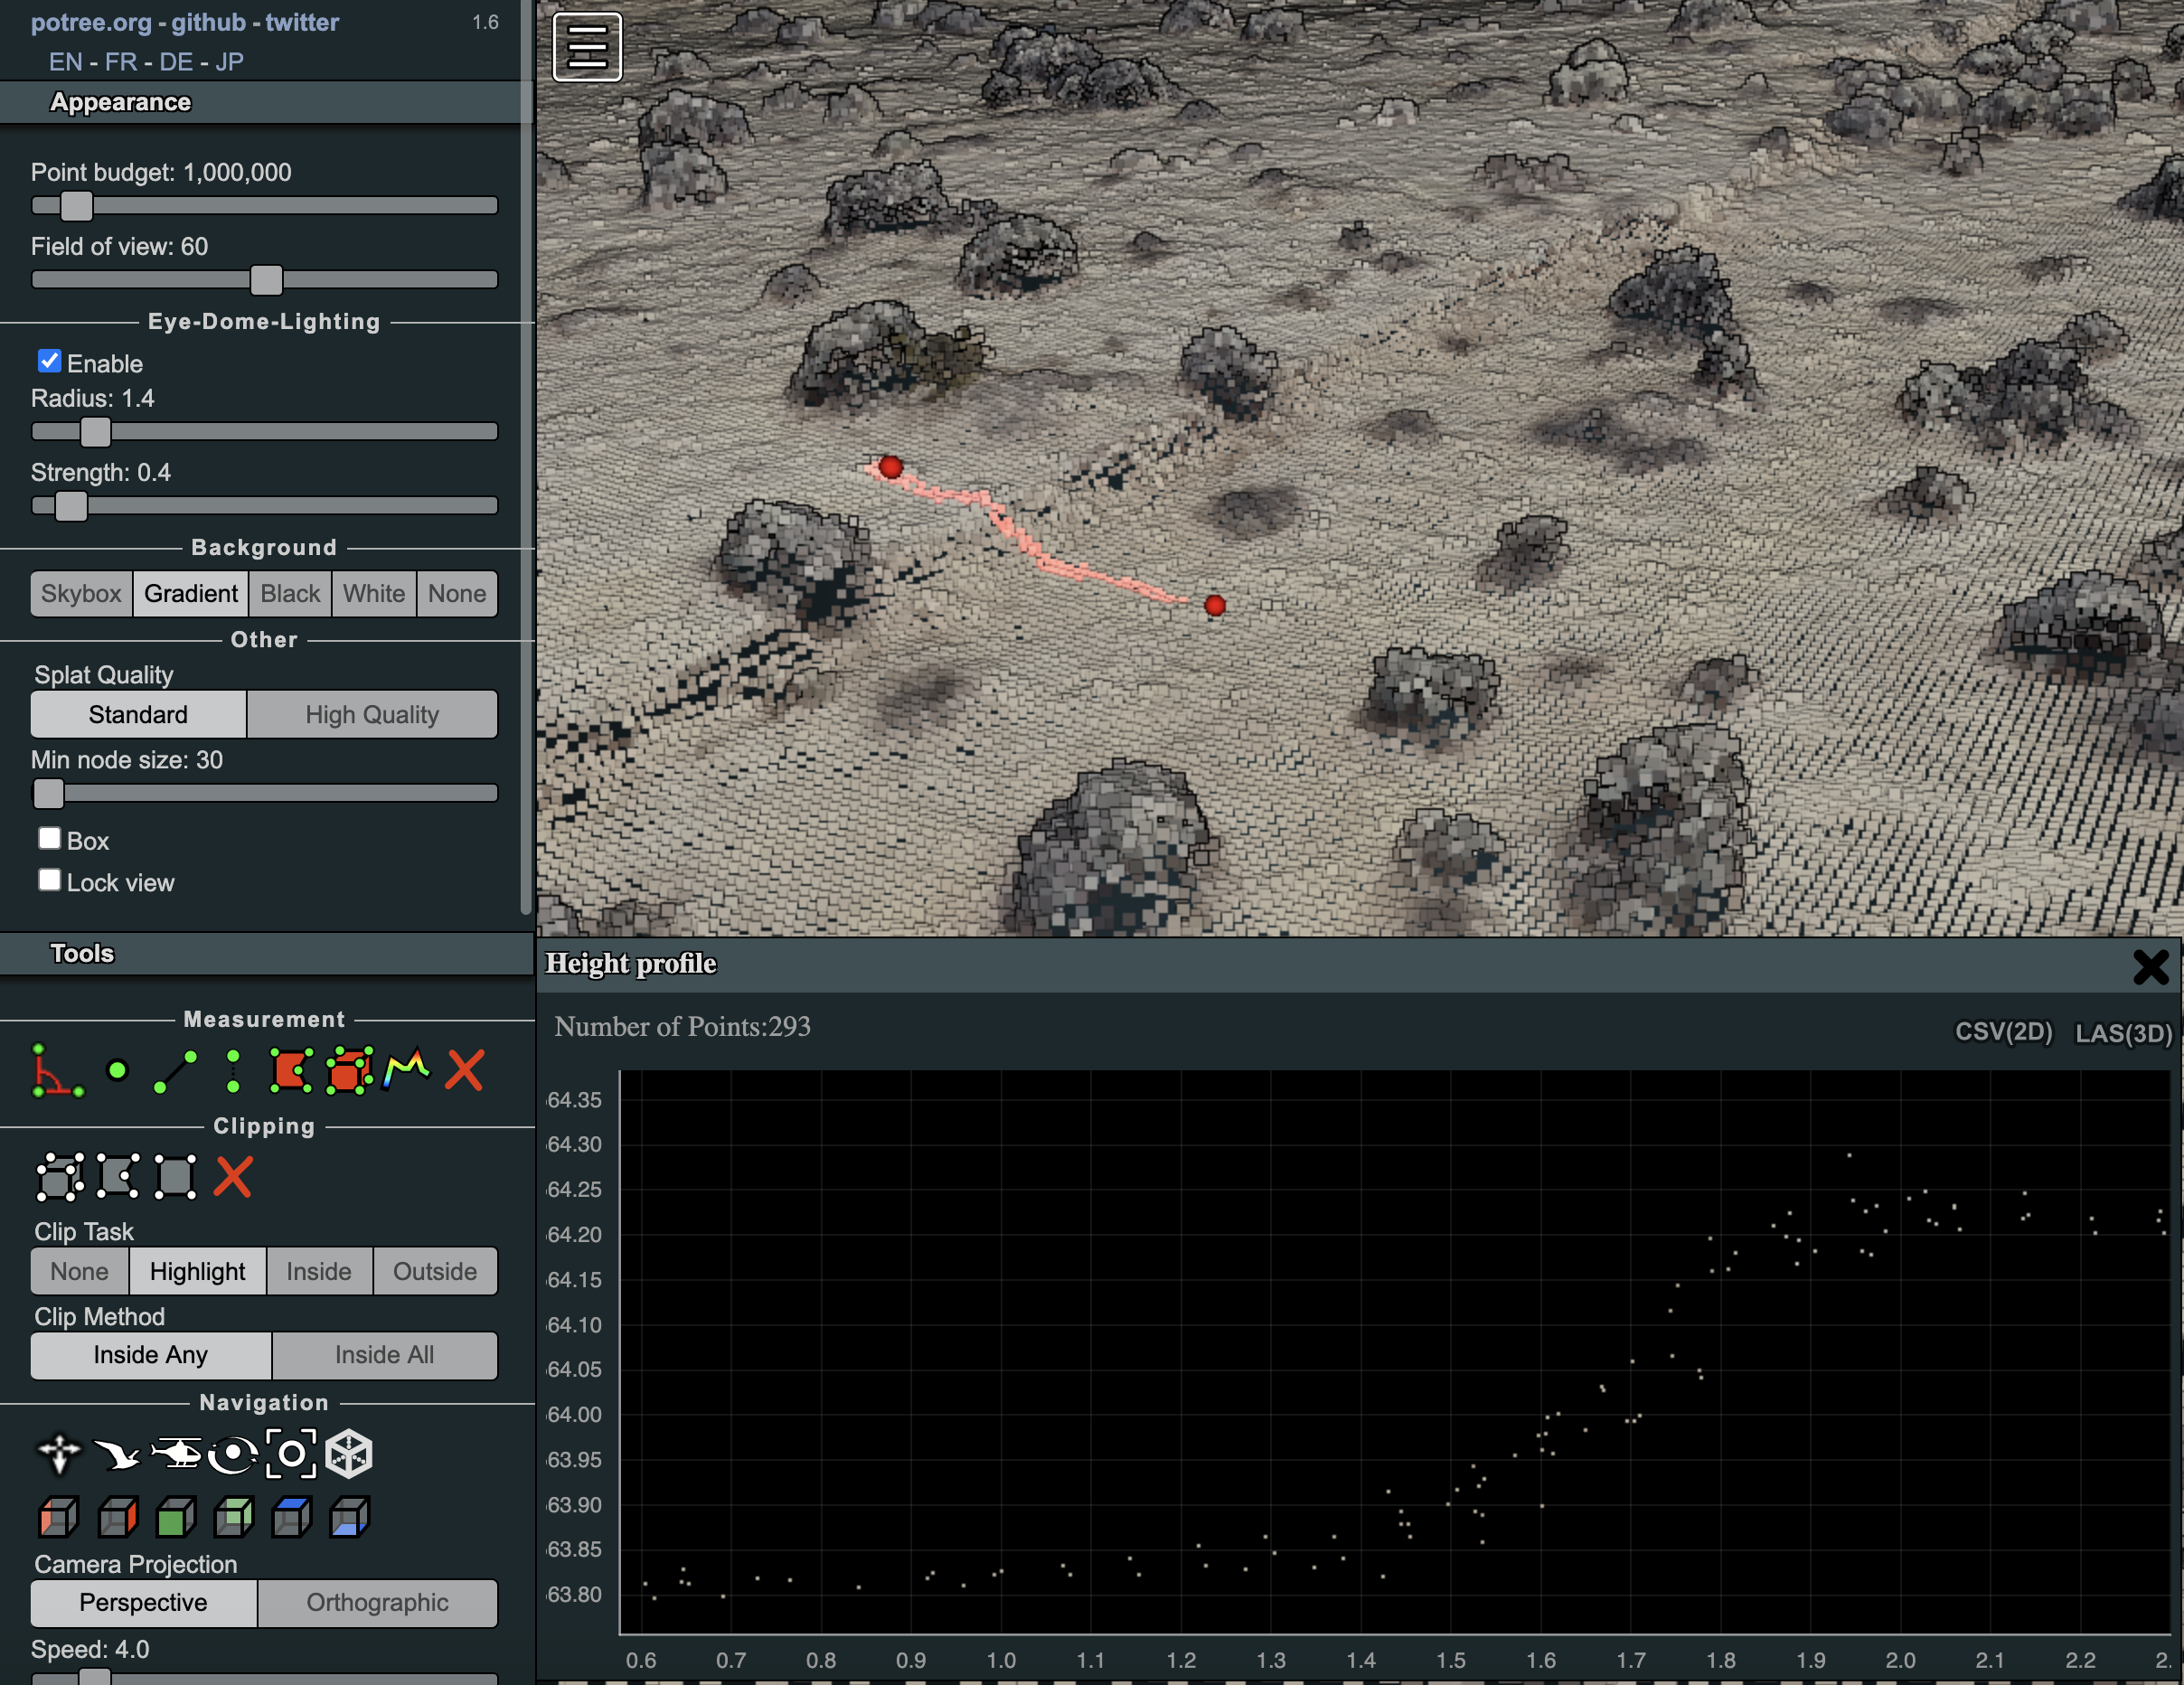
Potree Point Cloud Cross-section Tutorial
Note that the locations of the tools and options will vary somewhat in different version of potree, but the process is similar. The current version of potree Viewer in DesignSafe is 1.6. The figure below shows examples of tools in version 1.6.
To view data in potree, the following mouse movements are used to navigate the scene.
- Double Click- sets center of rotation and zooms into that point.
- Left Click, hold and move mouse, rotates the view
- Middle Scroll Wheel – Zooms in and out
- Right Click, hold and move mouse pans in the scene
Potree enables you to extract cross sections of the data. To extract those cross sections, do the following:
- Click on the menu button (3 horizontal lines) in the upper left-hand corner of the view window.
- Scroll down to the "Tools" bar and click.
- Select the tool icon that looks like a multicolored M.
- When you mouse over the point cloud data, you should now see a red ball attached to your mouse cursor. This allows you to drop nodes and establish the location of your profile.
- When you want to finalize your profile double click on the last node. Once a profile is finalized, you can still change its location by clicking on the red nodes and dragging them to a different location.
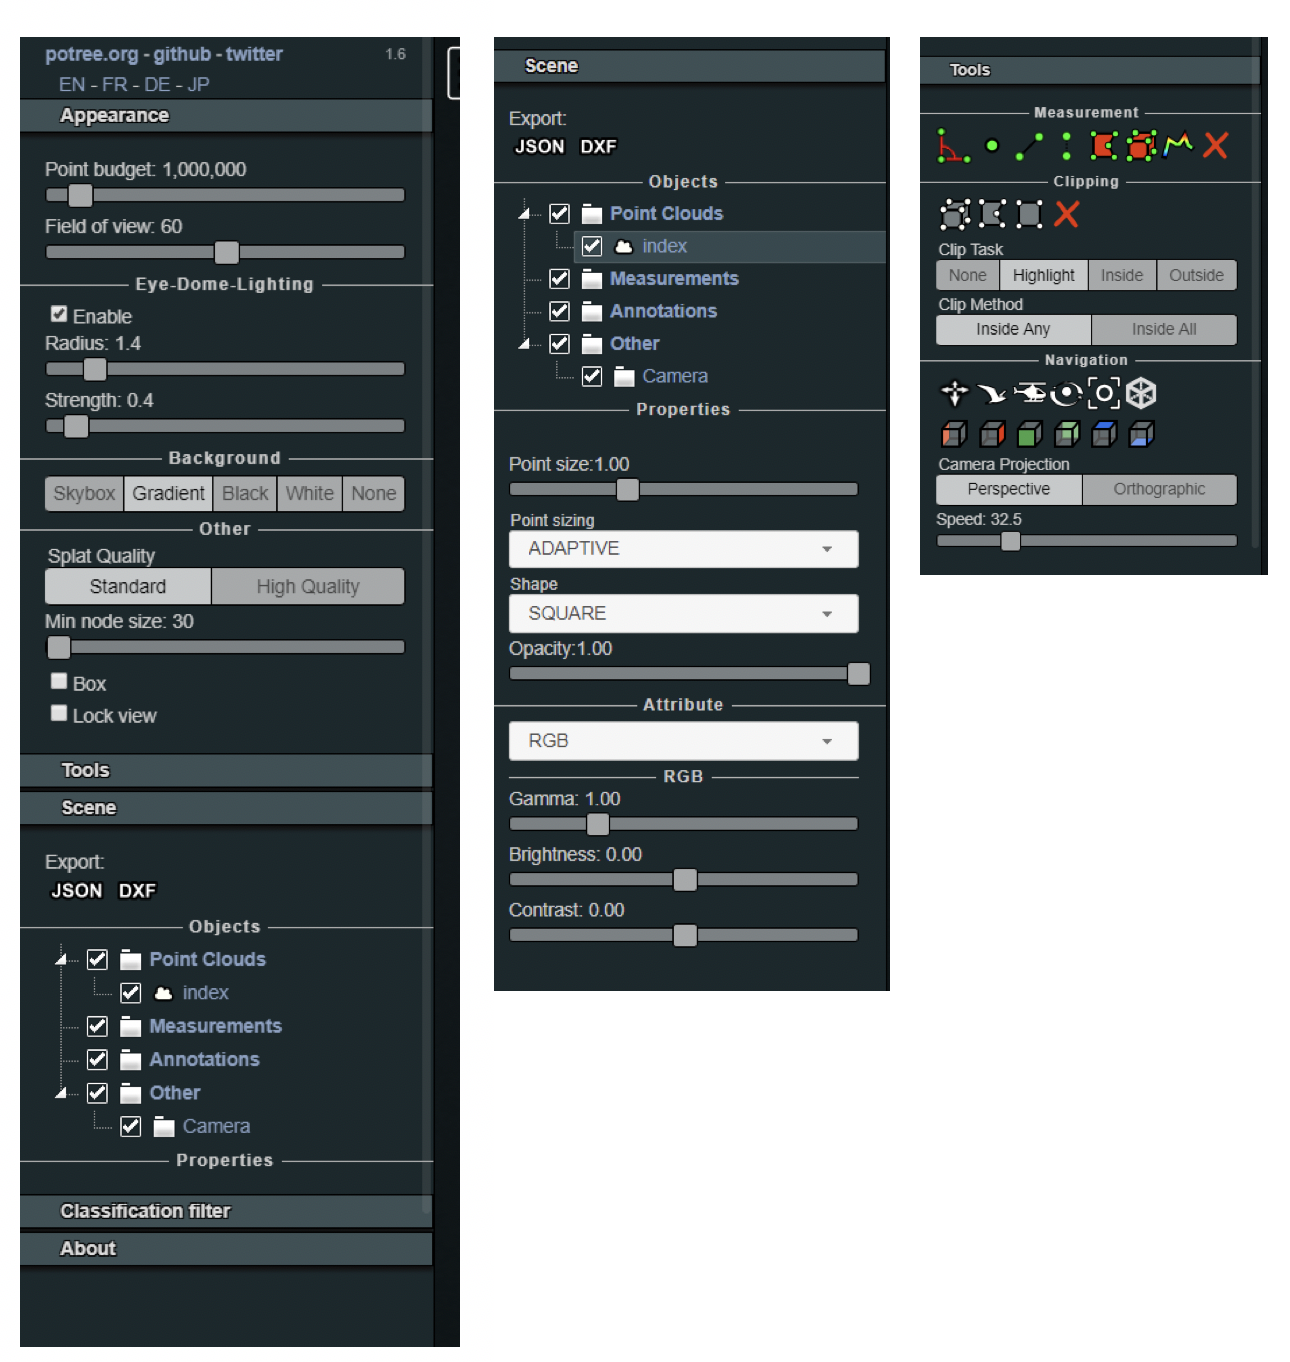
- Now, return to the side menu and click on the "Measurements" bar. You should see a Profile item with coordinates listed. Click the "show 2D profile" button. This is also where you can delete profiles by clicking the red X.
- A profile of the lidar data should now be visible at the bottom of the screen. The profile will also update in real time if you move the profile throughout the data.
- The save button in the upper right corner of the profile window will download a las file containing the points from the profile. This is useful for extracting the data you want to use for further analysis.
QGIS Desktop User Guide
QGIS is a free and open source Geographic Information System. Geospatial information can be created, edited, visualized and analyzed using this application. This application runs as an interactive QGIS Desktop session on a virtual machine using VNC technology.
You will have to fill out a form to submit your job that asks for two information (Desktop Resolution and Job name). Desktop Resolution sets the desktop screen size for your QGIS Desktop session. Additionally, you will have to select a recognizable job name in this form. Once the form is filled you can select “Launch” to submit your job.
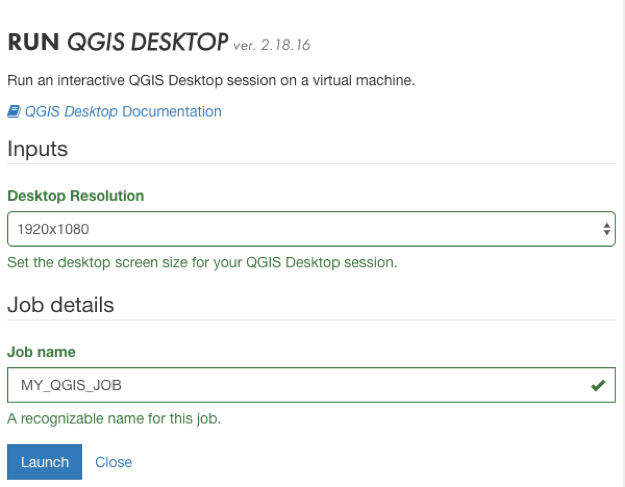
You can track the status of your job to the right side of the application page. The status will change from “Pending” to “Staged”, “Submitting” and “Running”. These processes usually take about 1 to 2 minutes. Few seconds after the change of status to “Running”, a message will be shown on the window that allows for connection to the interactive session (see figure below).
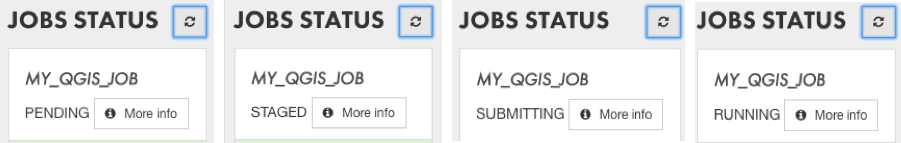
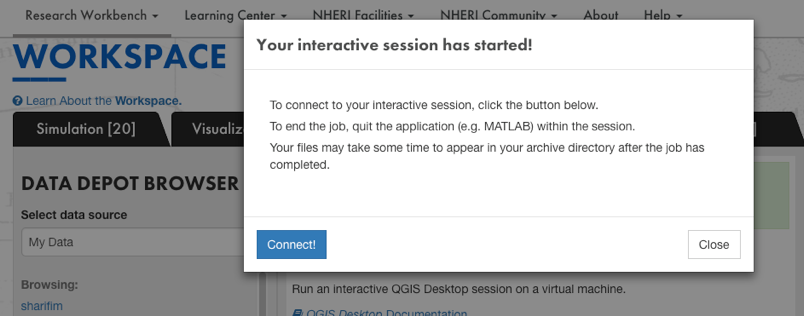
By clicking on Connect, a new tab will be opened that comprises QGIS interactive session.
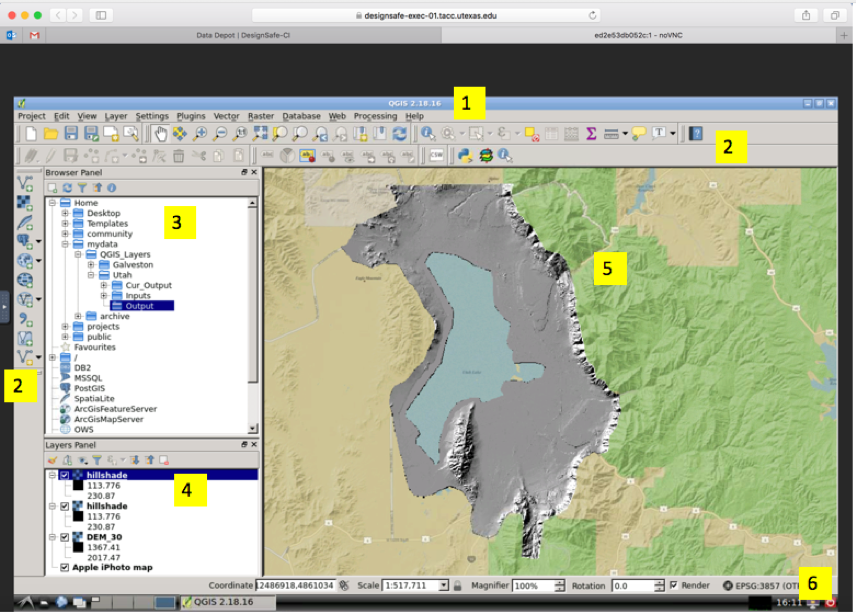
QGIS has the following components: (1) Menu Bar, (2) Toolbars, (3) Browser Panel, (4) Layers Panel, (5) Map view, (6) Status Bar
Load raster and vector layers from the sample dataset
You can either use Browser Panel to browse to your dataset (e.g. mydata or projects) and drag and drop it to Layers panel for visualization or from toolbar, you can select 'Add Raster Layer' and 'Add Vector Layer' icons to select raster or vector layers respectively.
A full documentation on QGIS software and its capabilities can be found at: https://docs.qgis.org/2.8/en/docs/user_manual/introduction/getting_started.html.
STKO User Guide
The Scientific ToolKit for OpenSees (STKO) is a data visualization tool for OpenSees, it creates an input (Tool Command Language, TCL) and output file, which can be read with its advanced graphic interface. The preprocessor features advanced CAD modeling tools and provides a comprehensive set of meshing algorithms. This application runs as an interactive STKO Desktop session on a virtual machine using VNC technology.
More detailed information and STKO user documentation can be found on the http://www.asdeasoft.net/stko?product-stko
-
You will have to fill out a form to submit your job that asks for three pieces of information.
- Desktop Resolution: The desktop screen size for your STKO Desktop session.
- Maximum Job Runtimes: The maximum time user expect to use STKO Desktop session.
- Job Name: Enter a recognizable job name. 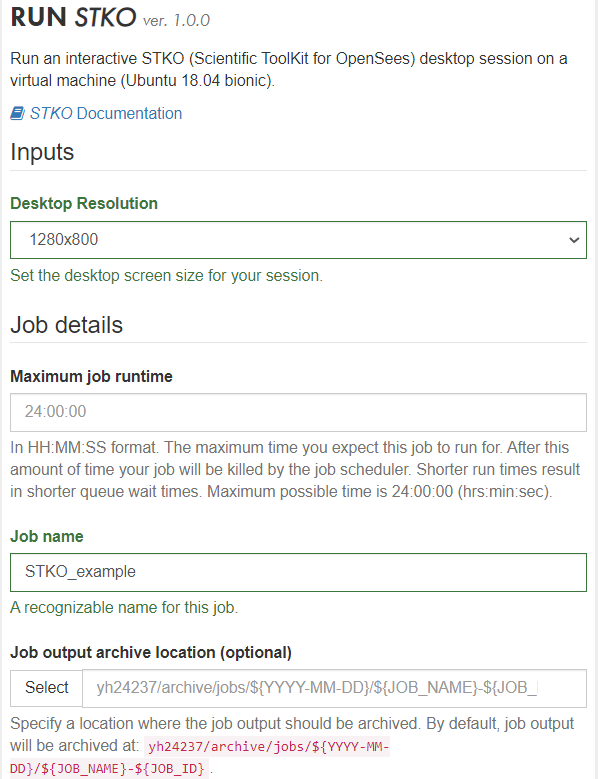
- Once the form is filled, user can select “Run” to use STKO on a virtual machine.
- By clicking on “Connect!”, a new tab will be opened that comprises STKO interactive session (see figure below). 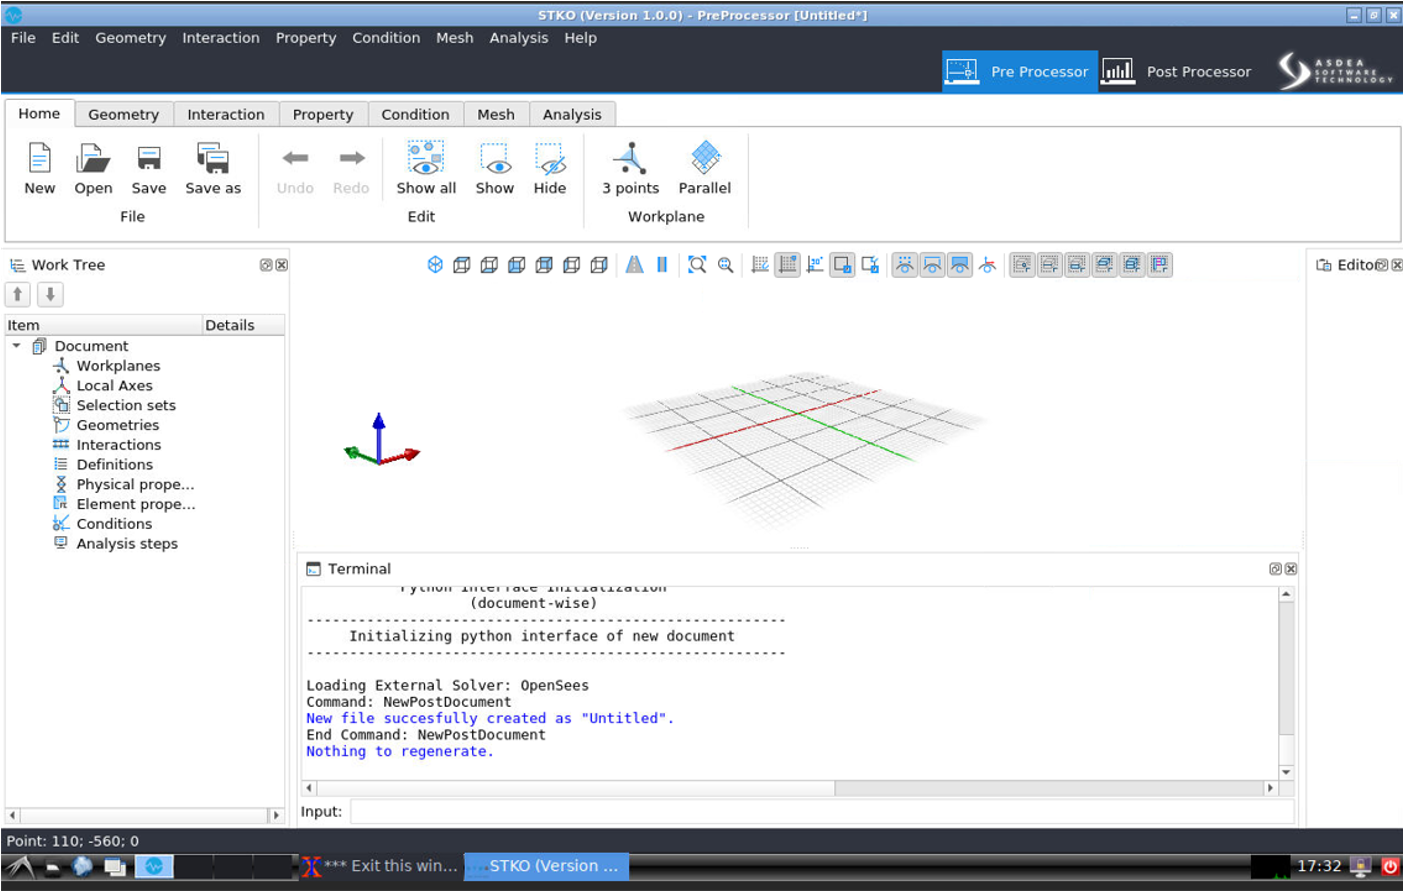
- User should save their STKO files (e.g., mpco and mpco.cdata files) in their own folder under “mydata” folder when using a virtual machine. Note that the user can also check (or upload and download) these files via DATA DEPOT on DesignSafe. 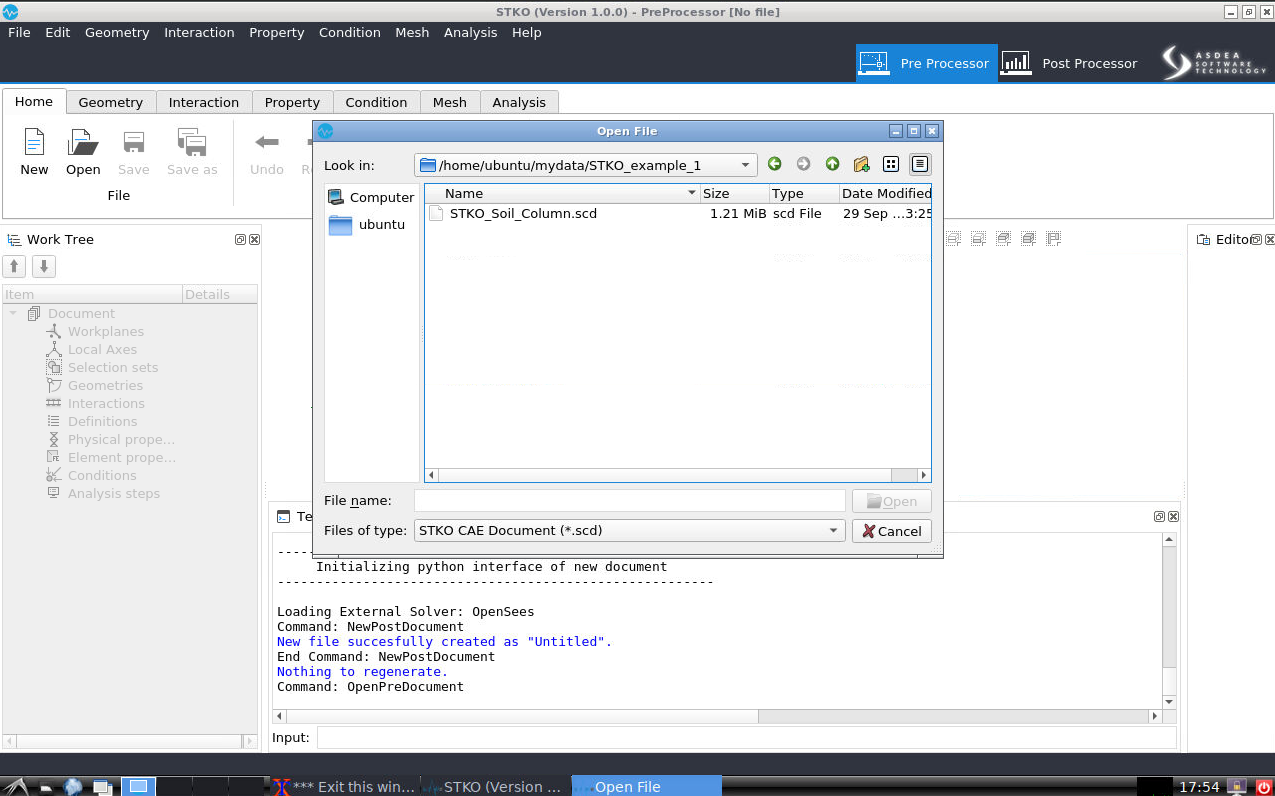 
Run OpenSees-STKO on DesignSafe
- After users create their Tcl scripts and mpco.cdata files in their folder (e.g., “STKO_example_1” in this example). Users can submit the OpenSees Job via OPENSEESMP (V 3.0)-STKO in this page: https://www.designsafe-ci.org/rw/workspace/#!/OpenSees::Simulation
- The input directory should contain OpenSees TCL script and mpco.cdata files. The filename is the OpenSees TCL script from STKO to execute. This file should reside in the input directory specified. If user use STKO to generate all the scripts, the default filename will be called 'main.tcl'. 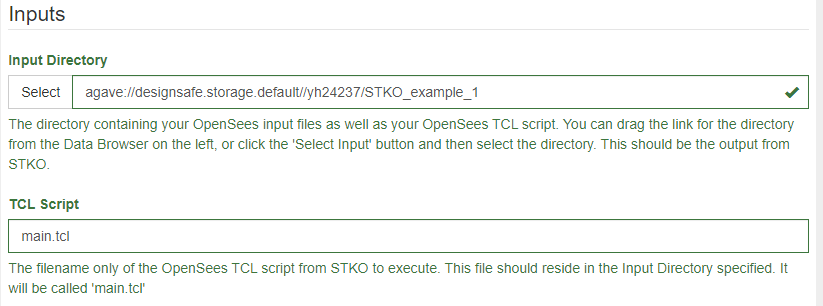
- If users do partition mesh in STKO, users can use OpenSeesMP to speed up their analysis. The number of processors should be equal to the number of partitions in users’ STKO models. More detailed information and OpenSeesMP user documentation can be found on: https://www.designsafe-ci.org/media/filer_public/c4/d6/c4d6aaef-5035-4506-9c4b-256fdaa47d0f/openseesmp.pdf 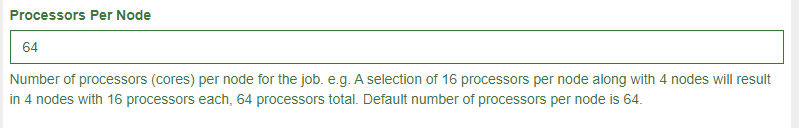
- Click Run to submit your job.
- After the analysis is finished, the user can use an interactive STKO Desktop session to post-process and visualize the results. 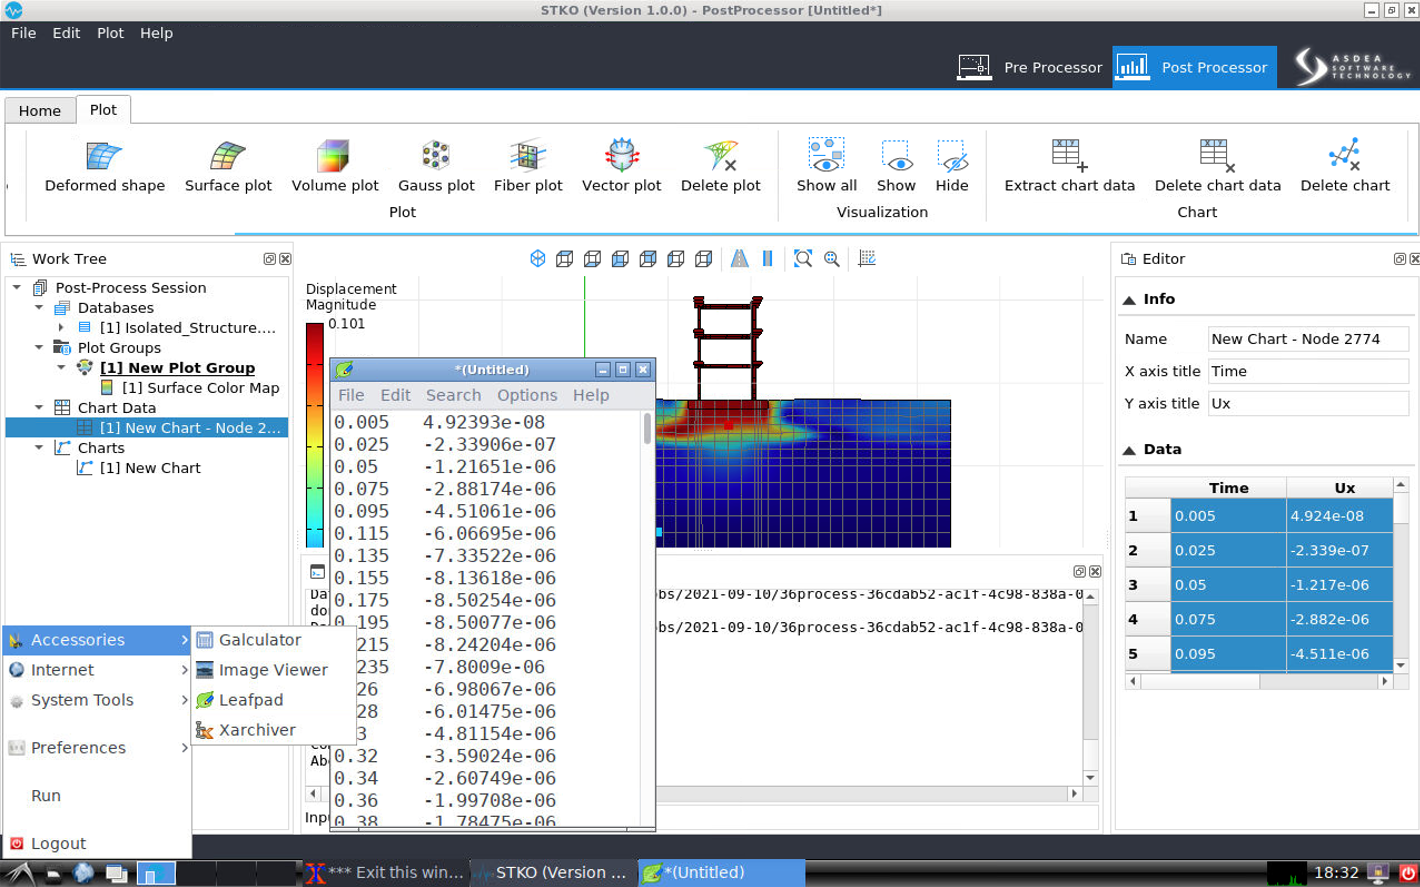
Taggit User Guide: Basic Image Browsing and Mapping
Using HazMapper and Taggit to browse thumbnails of large numbers of images and map their locations
Fred Haan – Calvin University Key Words: Taggit, HazMapper, image browsing
Resources
The example makes use of the following DesignSafe resources:
Description
This user guide demonstrates how to use HazMapper and Taggit applications on DesignSafe to browse through large numbers of image files. HazMapper and Taggit should be considered different ways of viewing the same set of images. You see a thumbnail Gallery of those images when you use Taggit, and you see a Map of those images when you use HazMapper, but it is the same *.hazmapper file in both cases.
NOTE: You always start a Map/Gallery file in HazMapper. All browsing/mapping starts with HazMapper, and you can switch back and forth between the apps as you wish. Also, at this time you cannot publish a Map/Gallery but this functionality is coming soon.
Creating a Map/Gallery and Browsing Images
Taggit and HazMapper allow you to browse and map image files that are on DesignSafe. This document shows you how to get started with Taggit and HazMapper for a set of images available on DesignSafe.
As an example workflow, we will consider a damage survey dataset from the December 2021 Midwest tornado outbreak (see below).
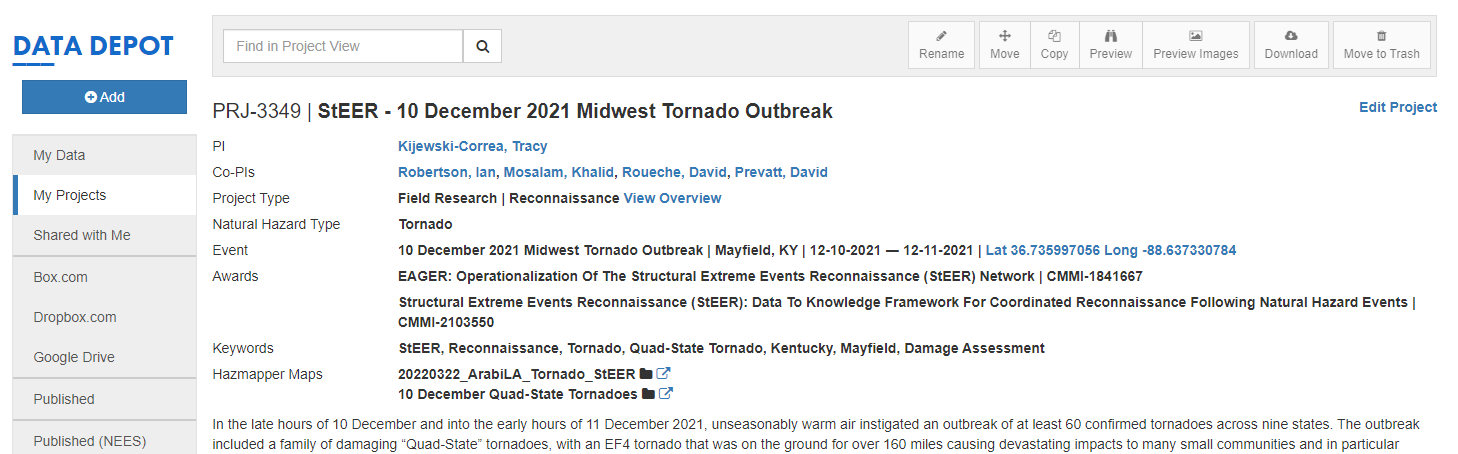
If you were looking at this project on DesignSafe, you might be interested in seeing the image files in the folder shown below.
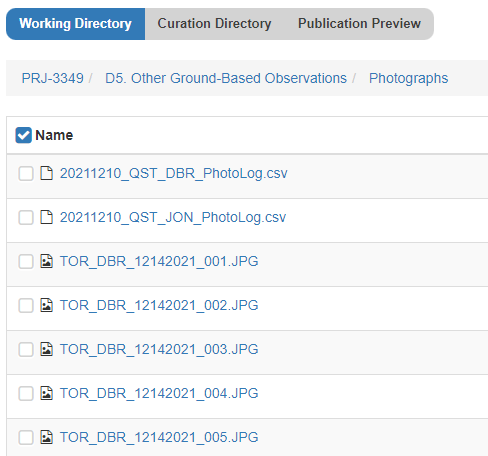
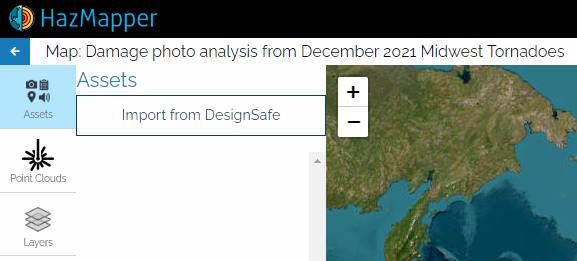
In order to browse thumbnail images of these photographs or see them laid out on a map, you can launch HazMapper to get started.
NOTE: All browsing/mapping starts with HazMapper. HazMapper and Taggit are just different ways of viewing the same Map/Gallery.
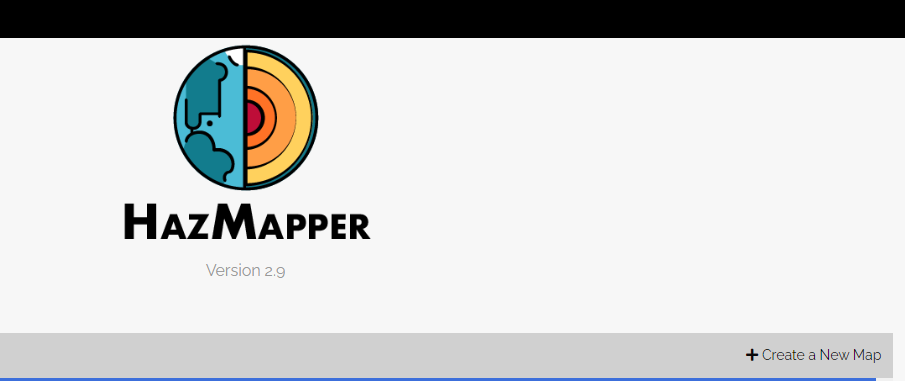
So to get started, we launch HazMapper from the Visualization tab of the Tools and Applications page of the DesignSafe Workspace.
Once HazMapper is up, click on “Create a New Map” as shown below:
Fill out a name and description of the “Map” you will create. This Map will also be a Gallery in Taggit. You then select a Save Location for your Map/Gallery by pulling down the menu on the right:
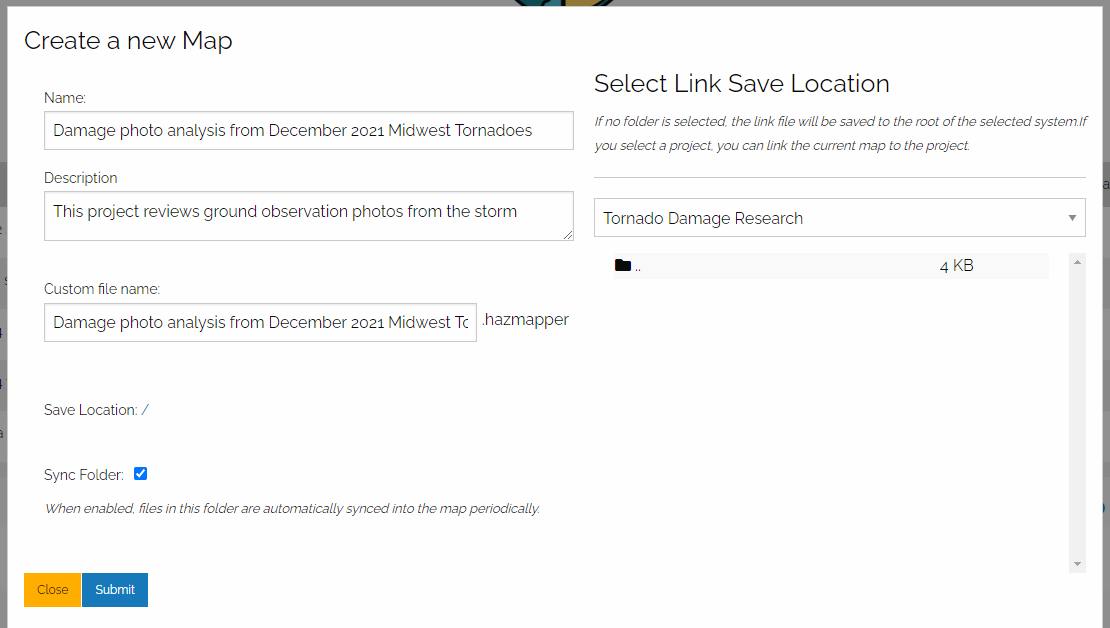
When you are selecting a Save Location, you should probably select from MyProjects. That way, you can share your Map/Gallery with other users. I selected a project called “Tornado Damage Research” as shown below.
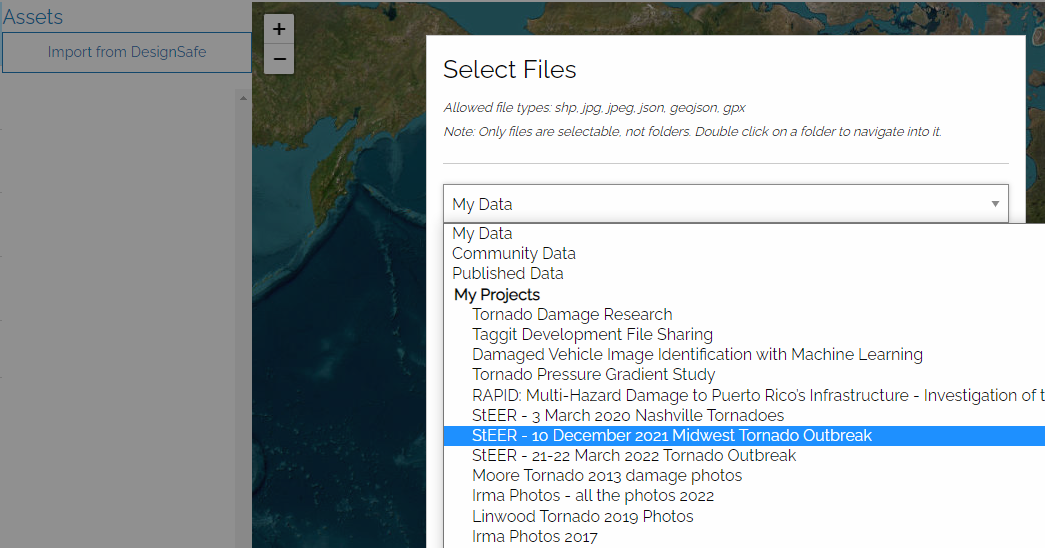
Next you click on Assets and Import from DesignSafe to load the images you want to see:
I'm going to select files from the StEER – 10 December 2021 Midwest Tornado Outbreak project:
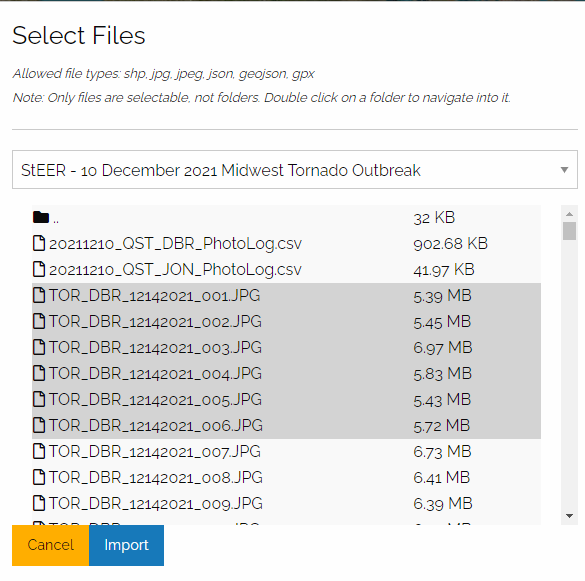
Once you navigate to the folder containing the image files you want, you can use shift-select to select multiple files to import:
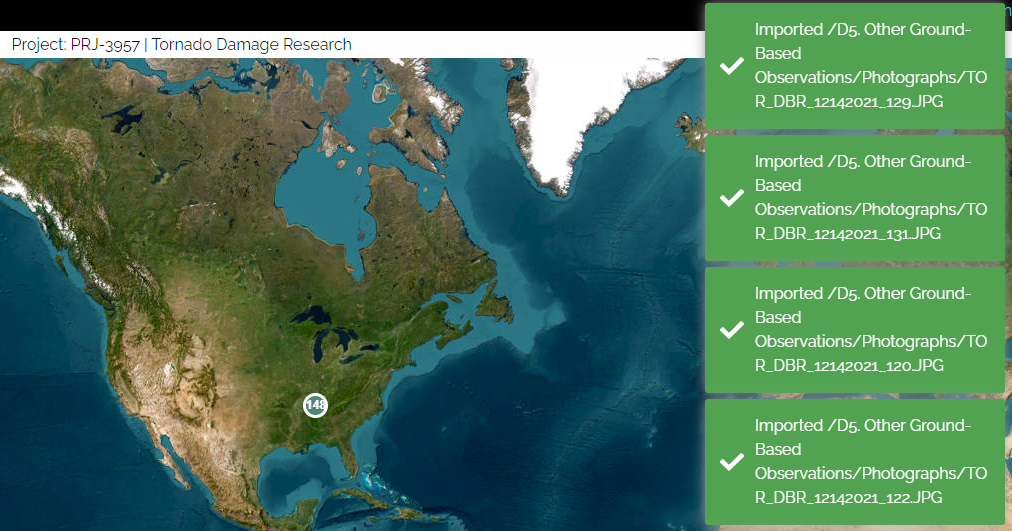
Once you press Import, you will see messages about successful imports on the right side of the screen:
Browsing Thumbnail Images in Taggit
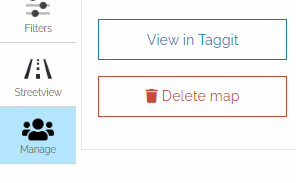
Once you've loaded your images, you can zoom in on your map to see the location of each photo. However, for this Taggit workflow demonstration, we will click on Manage and select View in Taggit as show below:
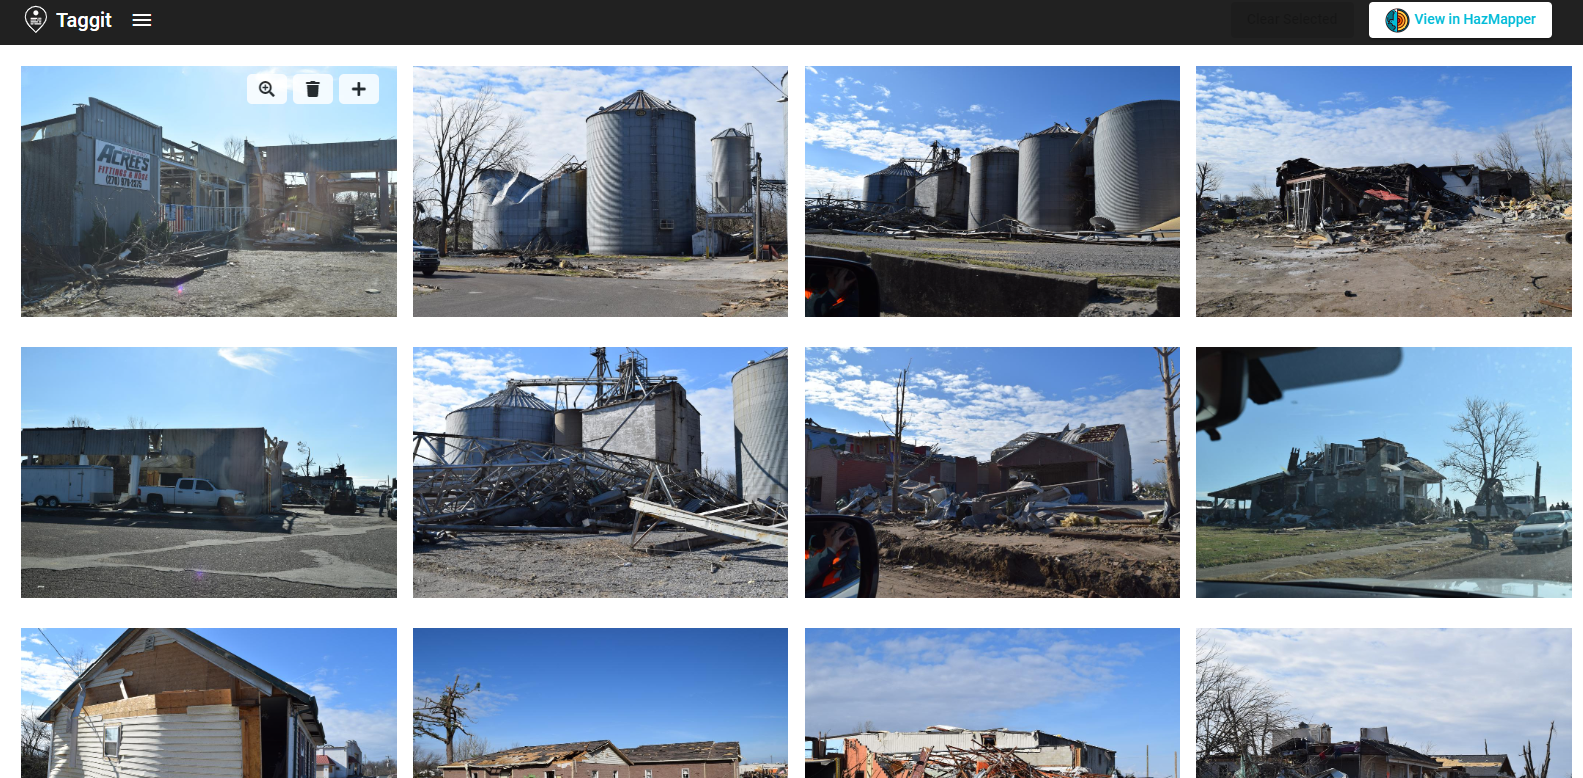
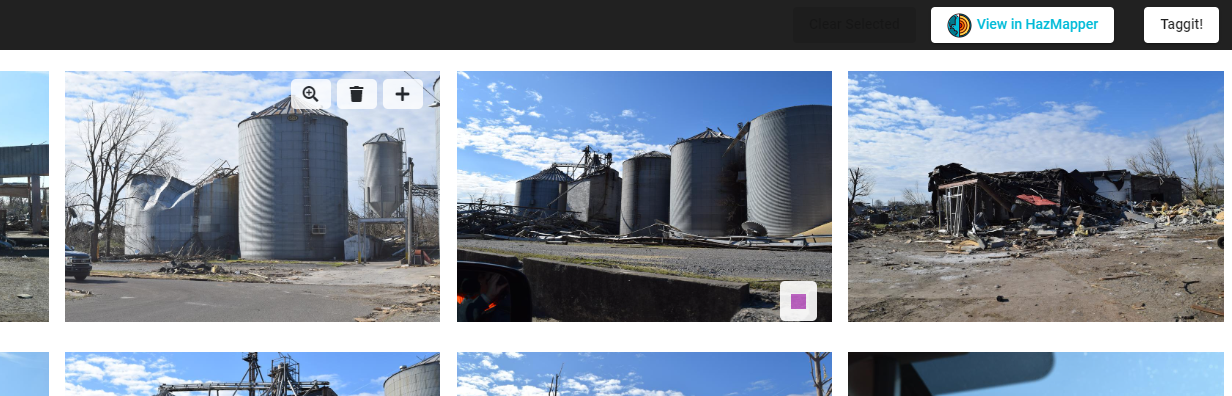
This will launch Taggit and show thumbnail images of all the photos that were just loaded in HazMapper. You can now browse through all the photos as shown below.
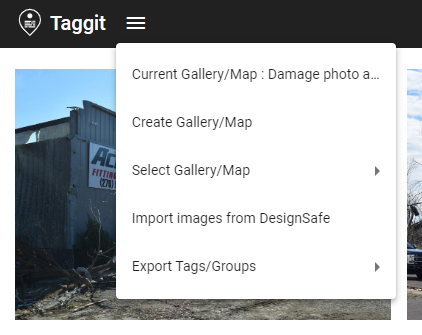
You can then add more photos to the Gallery using the pull-down menu in the upper-left corner. Selecting Import image from DesignSafe gives you access to all the files on DesignSafe.
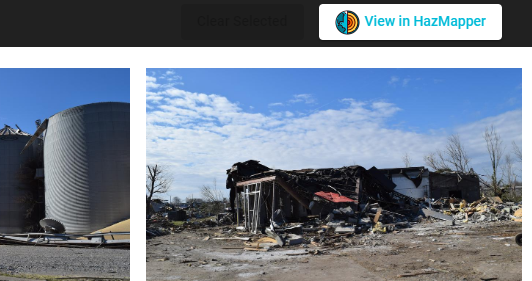
If you want to go back to HazMapper and put all the photos on a map, click the View in HazMapper button in the upper right corner of the screen.
References
- Kijewski-Correa et al. (2021) for PRJ-3349 StEER - 10 December 2021 Midwest Tornado Outbreak.
Taggit User Guide: Grouping and Tagging Image Files
Using Taggit to categorize image files with groups and tags
Fred Haan – Calvin University
Key Words: Taggit, HazMapper, image tagging, image grouping, image labeling
Resources
The example makes use of the following DesignSafe resources:
Description
This user guide demonstrates how to use Taggit on DesignSafe to organize image files into groups and to tag images. The groups and tags can then be saved for use in other programs (for example, for machine learning applications) or be used to present a set of images in a clear and organized way.
NOTE: You always start a Map/Gallery file in HazMapper. HazMapper and Taggit should be considered different ways of viewing the same set of images. You see a thumbnail Gallery of those images when you use Taggit, and you see a Map of those images when you use HazMapper, but it is the same *.hazmapper file in both cases. Also, at this time you cannot publish a Map/Gallery but this functionality is coming soon.
Taggit enables you to organize images into groups and to tag images. This document shows you how to create groups and tags with Taggit.
NOTE: Galleries in Taggit and Maps in HazMapper are actually the same thing. Taggit and HazMapper are just different ways of viewing the same Gallery/Map.
All browsing/mapping starts with HazMapper and you can switch back and forth between the apps as you wish.
This example begins with a Gallery that has already been created. If you do not know how to create a Gallery yet, start with the Basic Browsing and Mapping document and then come back to this one.
Creating Groups and Using the Taggit View
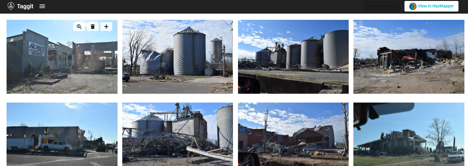
As an example workflow, we will consider a damage survey dataset from the December 2021 Midwest tornado outbreak (see below) and create some groups to organize these images.
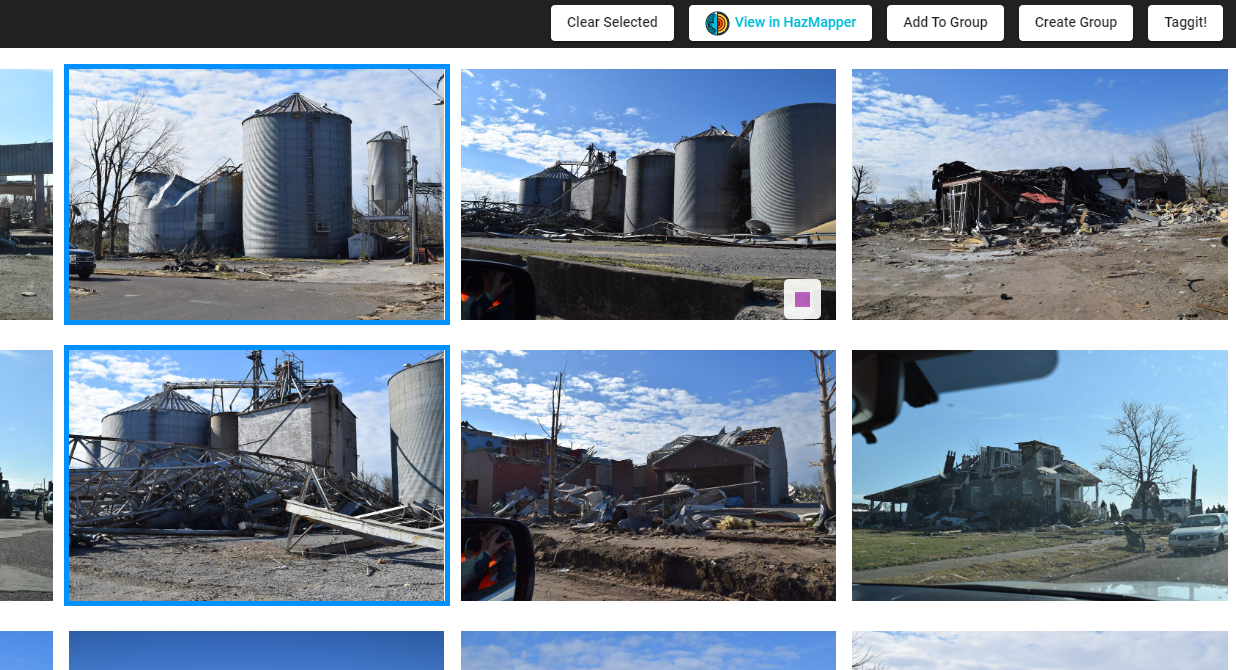
Clicking on any of the images, will put a blue border around the image and cause a Create Group to appear in the upper right corner as shown here:
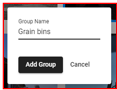
Clicking on Create Group will bring up a window in which to type in a name for your new group as show here. I am creating a group for all the Grain bins.
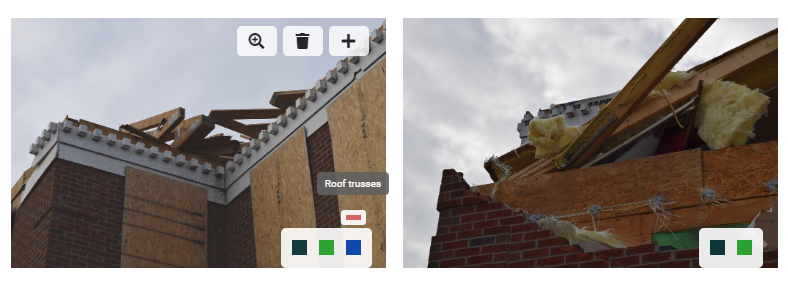
Two things then happen when you add this group. First, that image you selected become a part of the group, and you'll see a small colored square that indicates it is a part of the group (see below). Second, the Taggit button will appear in the upper right corner.
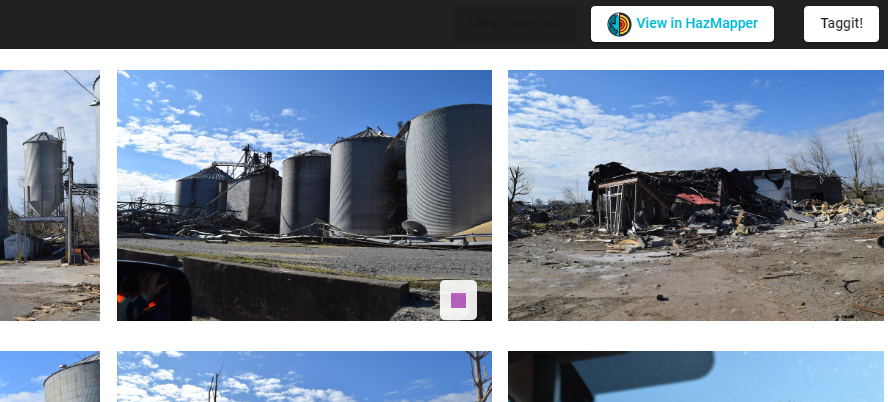
If you hover your mouse near the colored square, you will see the name of the group like this:
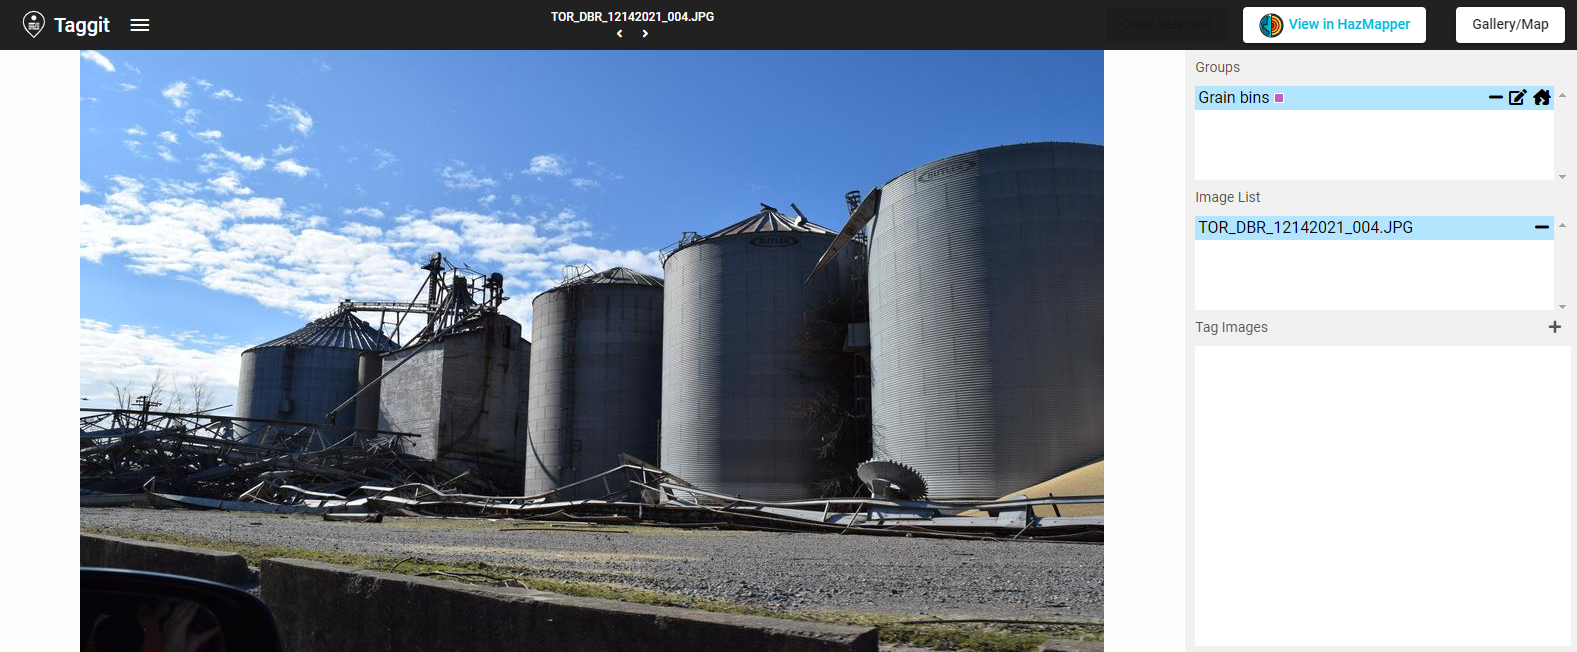
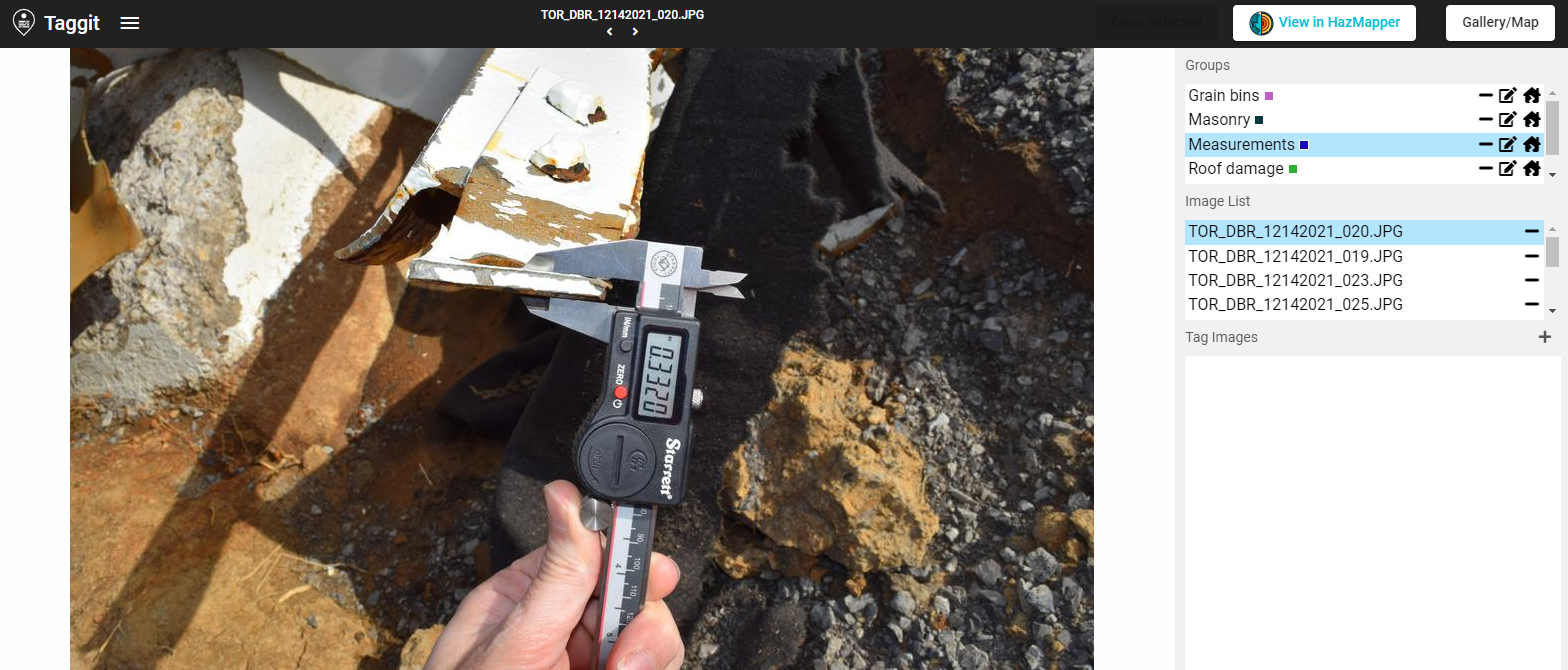
If you click the Taggit button, the screen will switch from the Gallery view to the Taggit view as shown below. This view will show the groups you have created and the images that are in each group. You can click on each image name to show them enlarged on the left. The Gallery/Map button in the upper right will send you back to the Gallery view.
Adding Images to Groups
To add more images to a group, you have two options. One option is to hover over an image and use the icons that appear (see below). The plus icon will bring up the option to add this image to a group. The magnifying glass and recycle bin allow you to enlarge the image or remove it from the Gallery, respectively.
The other option is to select a few images and then use the Add to Group button that appears when you select images as shown here. I selected two more grain bin images for this example.
Any given image can belong to multiple groups as illustrated by the group icons here:
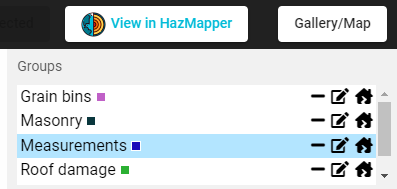
When you create more groups and assign images to each group, the Taggit view will list them all as show here:
Changing icons for each group
In the list of Groups in the Taggit view (shown below), each group's icon is shown on the right. If you click on that icon, you can change use a pull-down menu to change it if you wish.
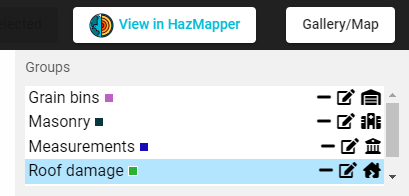
Modified icons are shown below for each of the groups. These icons are then used when that group's images are plotted in HazMapper.
Creating Tags within each Group
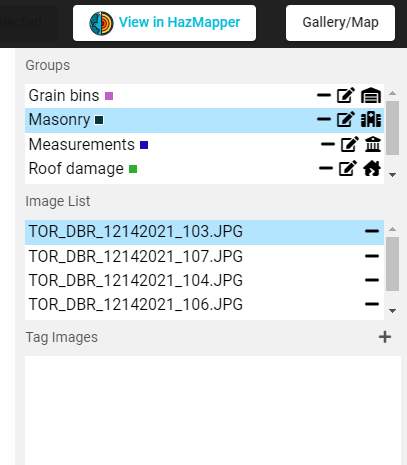
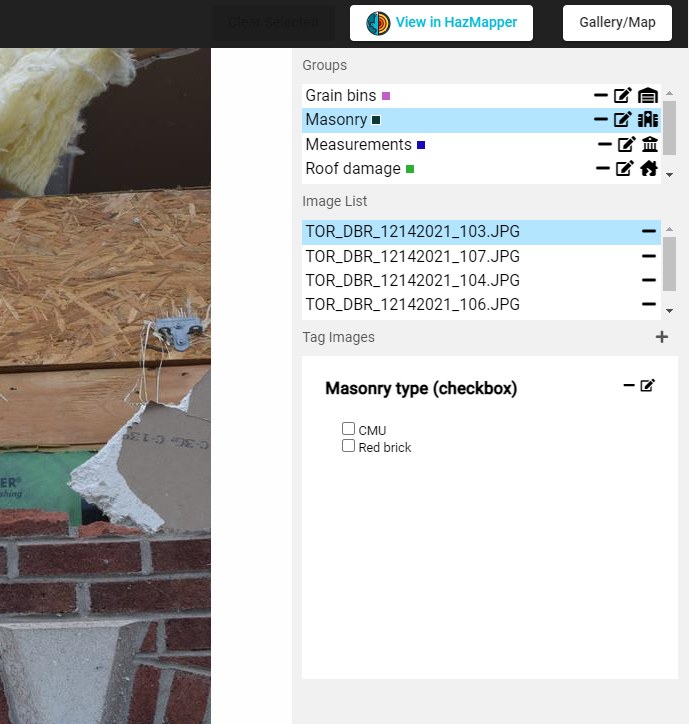
Within a given group, you can create custom Tags by clicking on the “+” icon in the Tag Images portion of the Taggit view (see below):
This will show the options for the types of Tags as shown below. You can create Tags that are just a text box (Text), a checkbox list, a radio button list, a dropdown menu of tag options, or a color tag. The color tag can be used to change the color that is displayed in HazMapper.
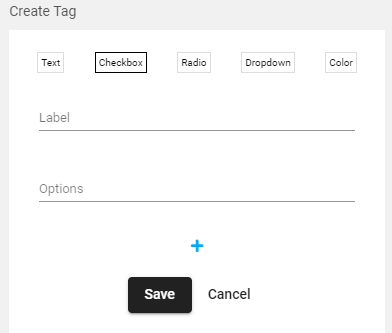
For this example, I am creating a Checkbox tag. The Tag itself has a Label and then you add as many Options are you wish by entering the name of each Option and then pressing the “+” button to add it to the list. In what is shown below, I added “CMU” as an Option, pressed the “+” to add it. Now I am adding Red brick as an Option, and am about to press the “+” to add it.
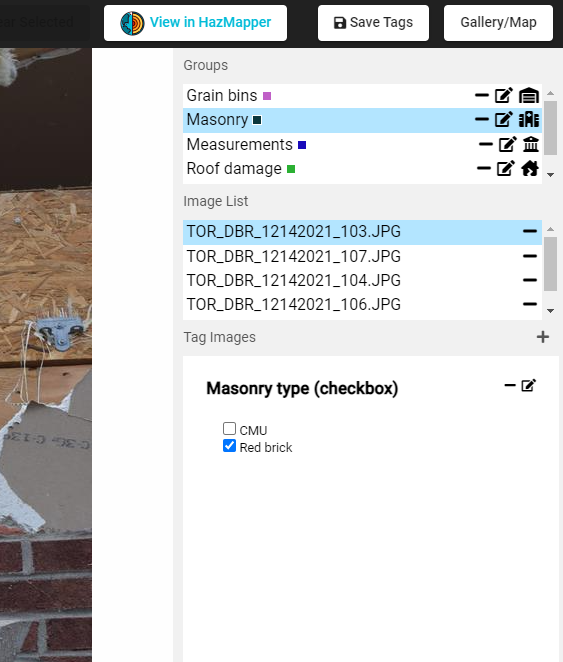
Once I have added all my options with the “+” button, then I press Save and I now have a Checkbox for each image in my Masonry group.
Clicking one of the Checkbox options will cause a Save Tags button to appear (as shown below). You do not have to click the Save Tags button between every Tag you enter, but you will need to click it before leaving the tagging of that group and going back to Gallery view.
Groups and Tags can be exported using the Export Tags/Groups option in the pull-down menu. You can export to your local machine or to a folder in DesignSafe. This export option will generate one json file and also separate csv files for each group in the Gallery.
References
- Kijewski-Correa et al. (2021) for PRJ-3349 StEER - 10 December 2021 Midwest Tornado Outbreak.
VisIt User Guide
VisIt is an Open Source, interactive, scalable, visualization, animation and analysis tool. Users can quickly generate visualizations, animate them through time, manipulate them with a variety of operators and mathematical expressions, and save the resulting images and animations for presentations. VisIt contains a rich set of visualization features to enable users to view a wide variety of data including scalar and vector fields defined on two- and three-dimensional (2D and 3D) structured, adaptive and unstructured meshes. Owing to its customizable plugin design, VisIt is capable of visualizing data from over 120 different scientific data formats.
More detailed information and VisIt user documentation can be found on the VisIt website.
How to Start a VisIt Interactive Session in the Workspace
- Select the VisIt application from the Visualization tab in the Workspace.
- Locate the directory containing your data files in the Data Depot and follow the onscreen directions to enter this as your Working Directory.
- Select your desired desktop resolution from the dropdown menu.
- Enter a maximum job runtime in the form. While this field is required in the form it is not actually used, simply enter any time using the time format shown.
- Enter a job name.
- Enter an output archive location or use the default provided.
- Select the number of nodes to be used for your job. Larger data files run more efficiently on higher node counts.
- Click Run to start your interactive session.
- Be sure to exit the Paraview application when you are finished with the session or any files saved will not be archived with the job.